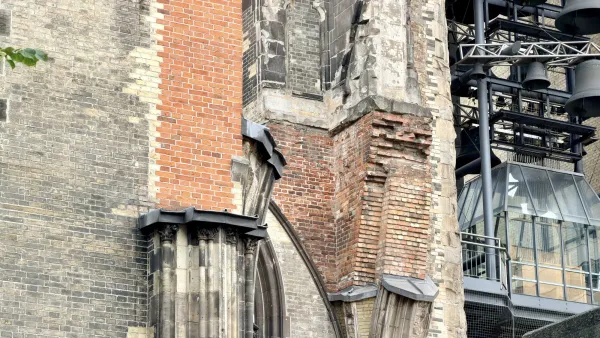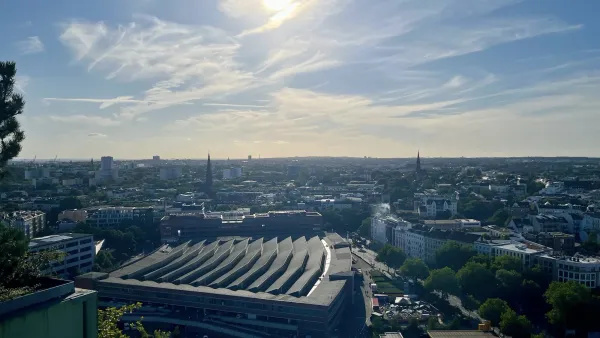
How good is Hamburg’s cycling infrastructure?
What is the Copenhagenize Index, and what does it show about where Hamburg’s cycling infrastructure is doing well and where it is falling behind?

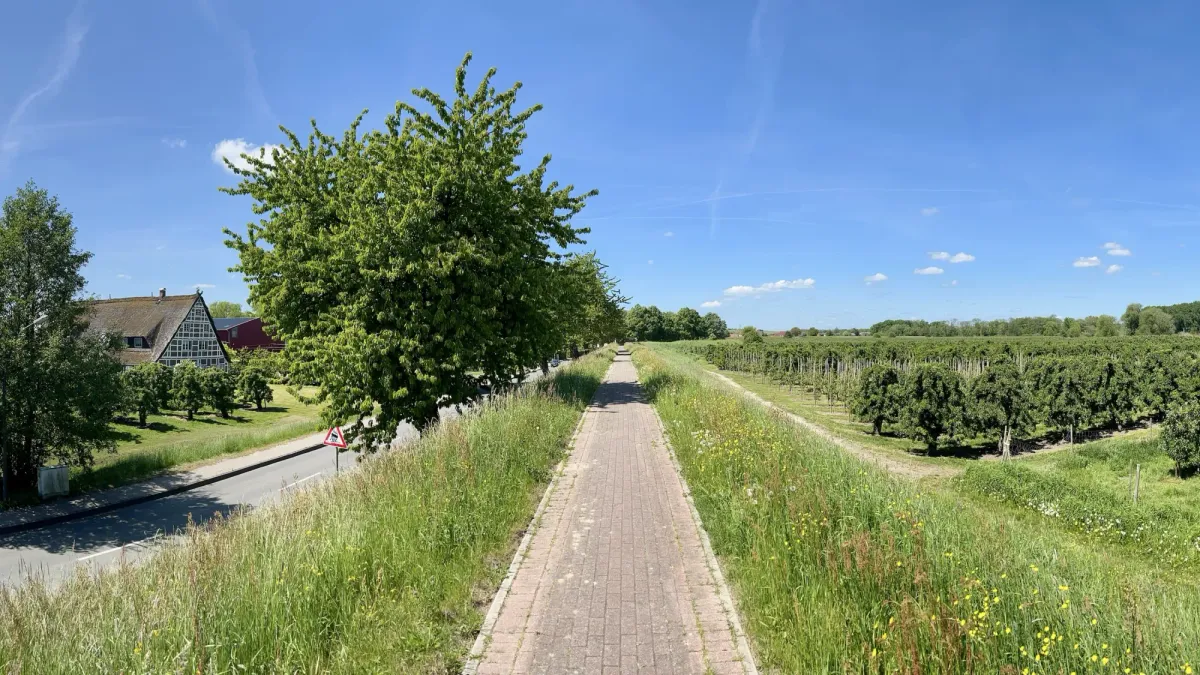
The first thing I did after moving to Hamburg was buy a bicycle. I enjoy cycling, and I really wanted to make it part of my daily life. At first, I did not use my bike very often. However, after buying an e-bike in the summer of 2022, I started cycling much more.
According to my bike’s app, I’ve cycled around 5.700 km. Although this includes some recreational trips, most of these kilometres came from commuting. This year alone, I’ve cycled around 1.300 km.
Just as I once thought Hamburg was probably one of the greenest cities, I also believed that it had good cycling infrastructure and that it was getting better every day. Of course, it is difficult to reach this conclusion based only on my own experience. I needed data and a way to compare Hamburg with other cities that are known as cycling paradises.
That is how I discovered the Copenhagenize Index. Started in 2011, it is a ranking that measures how much progress cities have made in making cycling safe, convenient, and part of everyday life. The 2025 edition evaluated 100 cities from 44 countries. It uses 13 indicators grouped into three pillars: Safe and Connected Infrastructure, Usage and Reach, and Policy and Support. In simple terms, it looks at what a city builds, how much people cycle, and how strongly the city supports cycling.
The top three cities in the 2025 index were Utrecht with 71,1 points, Copenhagen with 70,8 points, and Ghent with 67,6 points.
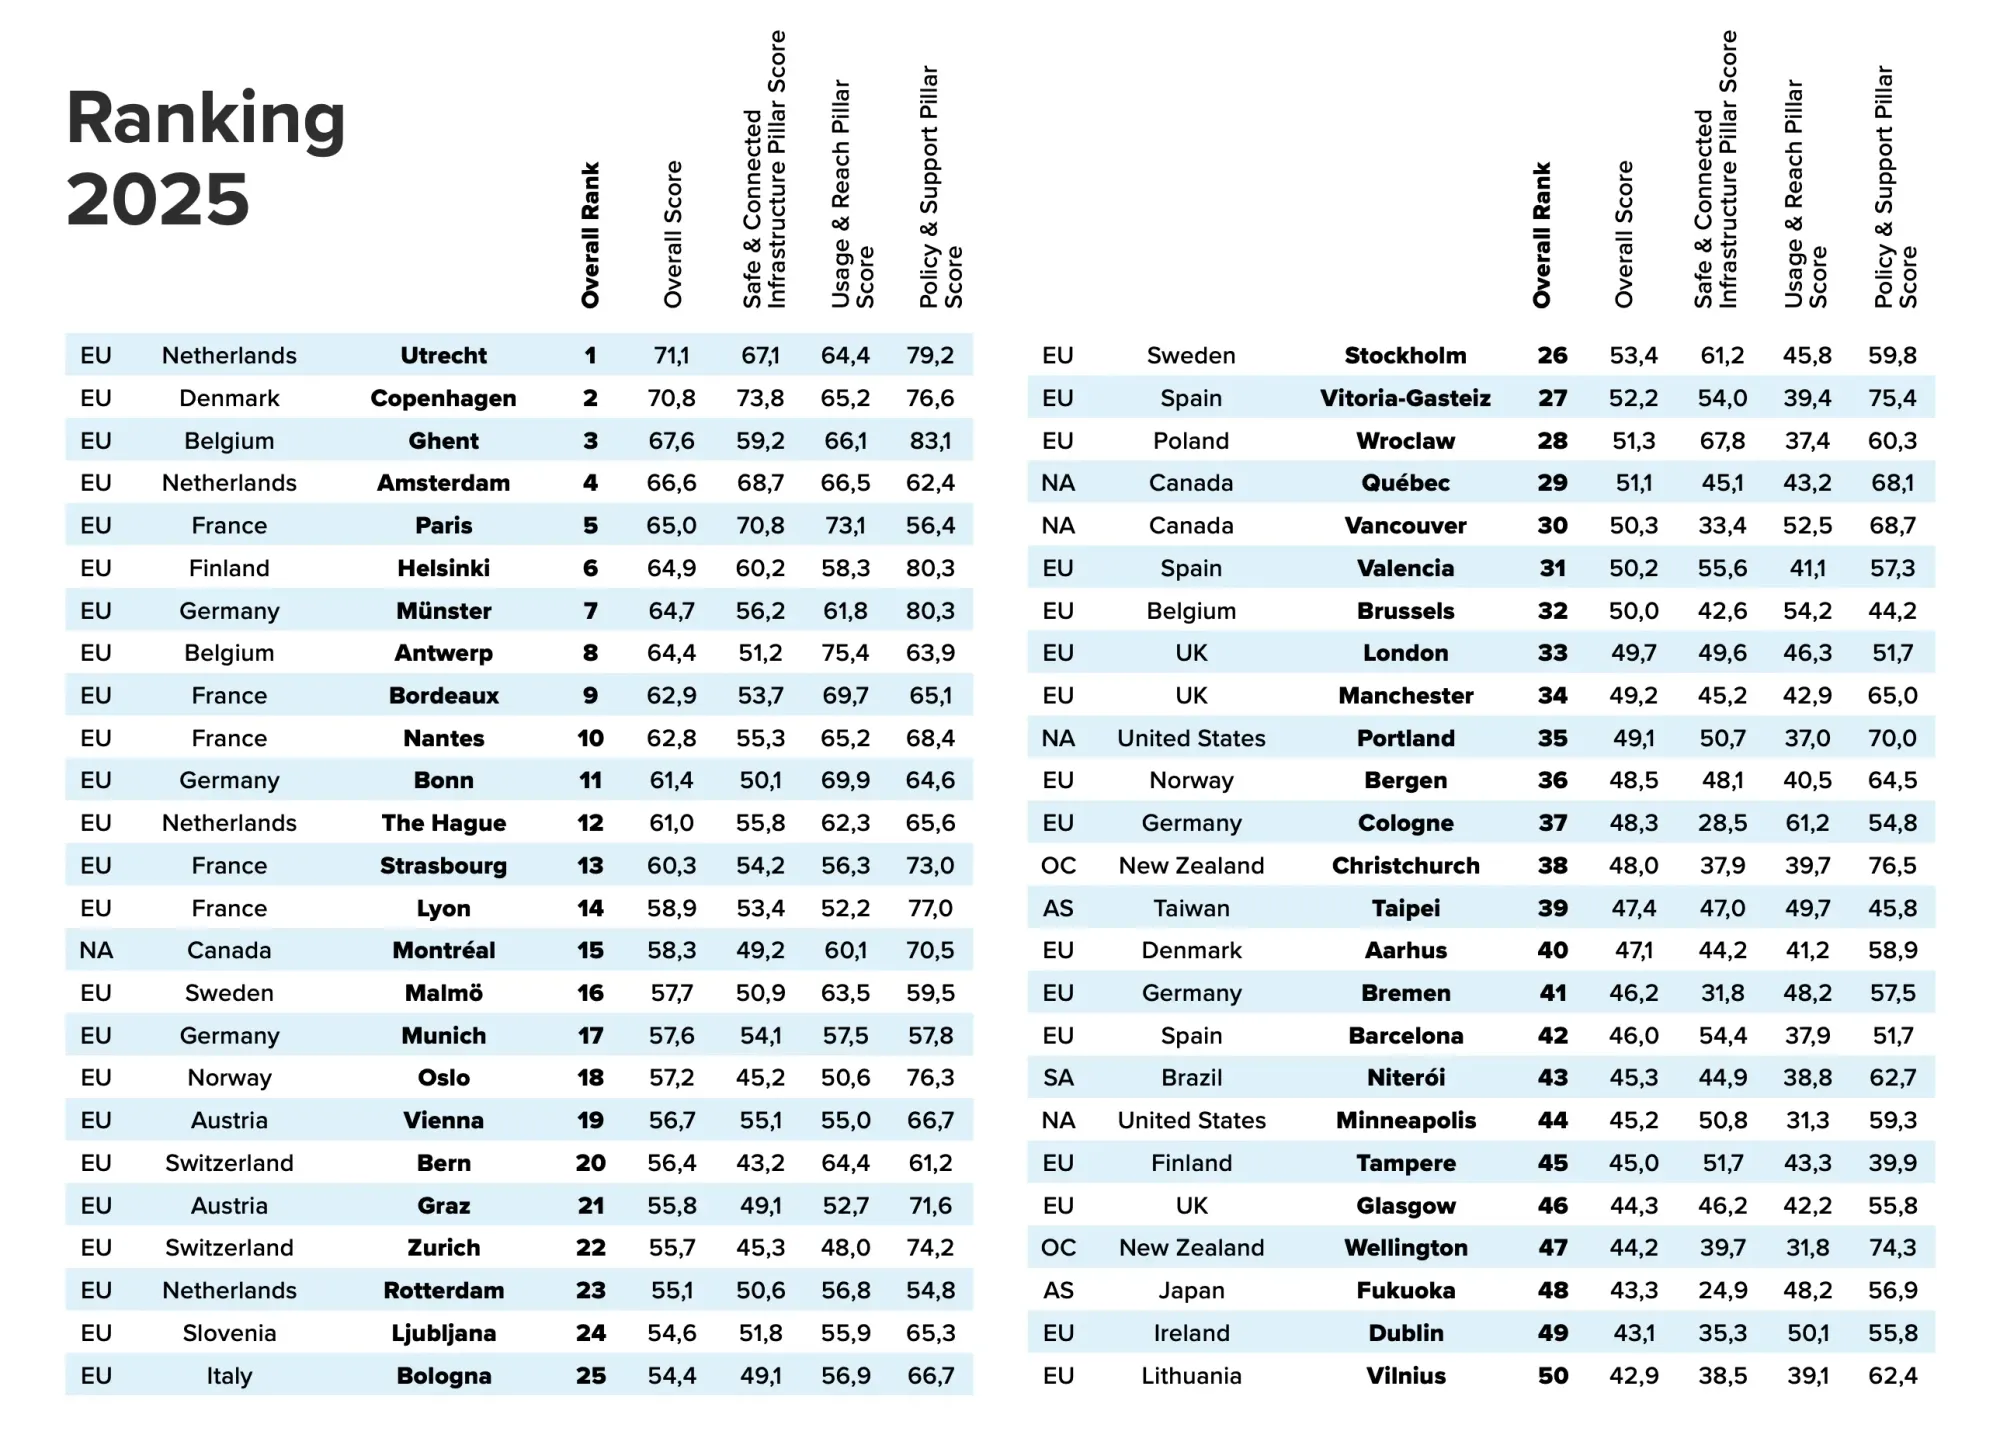
Even though the City of Hamburg submitted data to Copenhagenize, Hamburg was not included in the final ranking. The report includes no more than five cities from each country and gives priority to cities with the highest cycling modal share. Hamburg’s cycling modal share of 16% was lower than those of the five German cities included in the report: Münster at 47%, Bremen at 25%, Bonn and Munich at 21%, and Cologne at 18%.
I emailed Copenhagenize to ask whether they could share Hamburg’s score and more details about its cycling performance, but they told me that they could not provide this information.
Since the report explains its method, I decided to find the data for each pillar and indicator myself. I will then compare Hamburg with Utrecht, the highest-ranked city. This is not a perfect comparison because Utrecht is smaller than Hamburg in both area and population. Still, I think it can give us a good idea of where Hamburg is doing well and what still needs to be improved.
I should also mention that this is not an academic study. It is simply an attempt to understand where Hamburg stands. During my research, I realised how difficult it is to find data for every indicator. The available figures also come from different years, so the comparison has its limits.
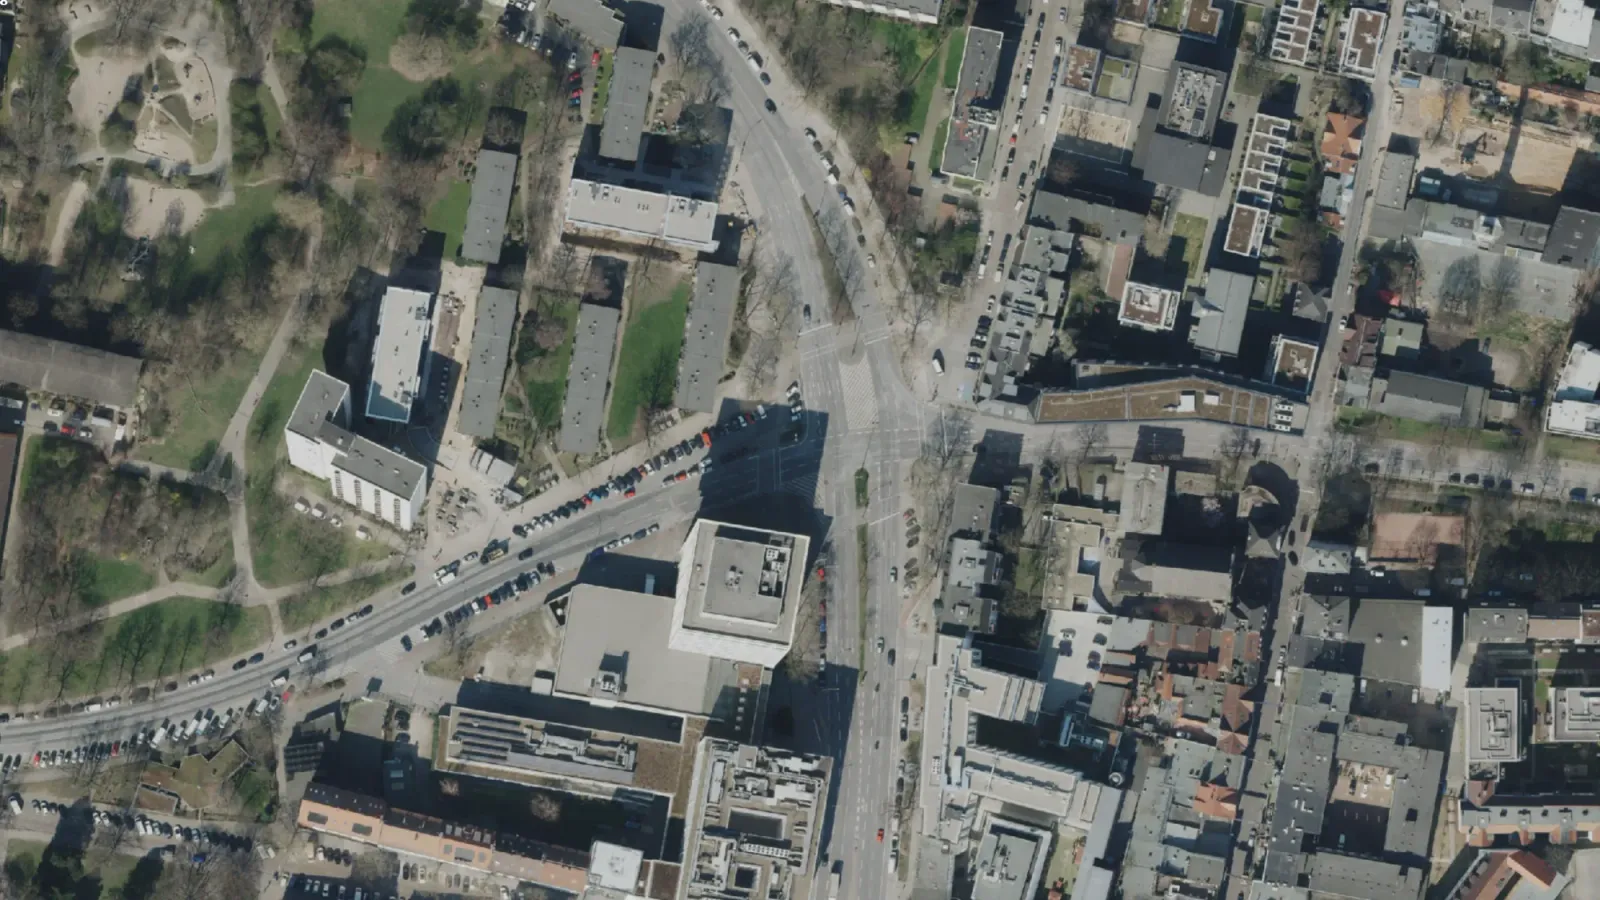
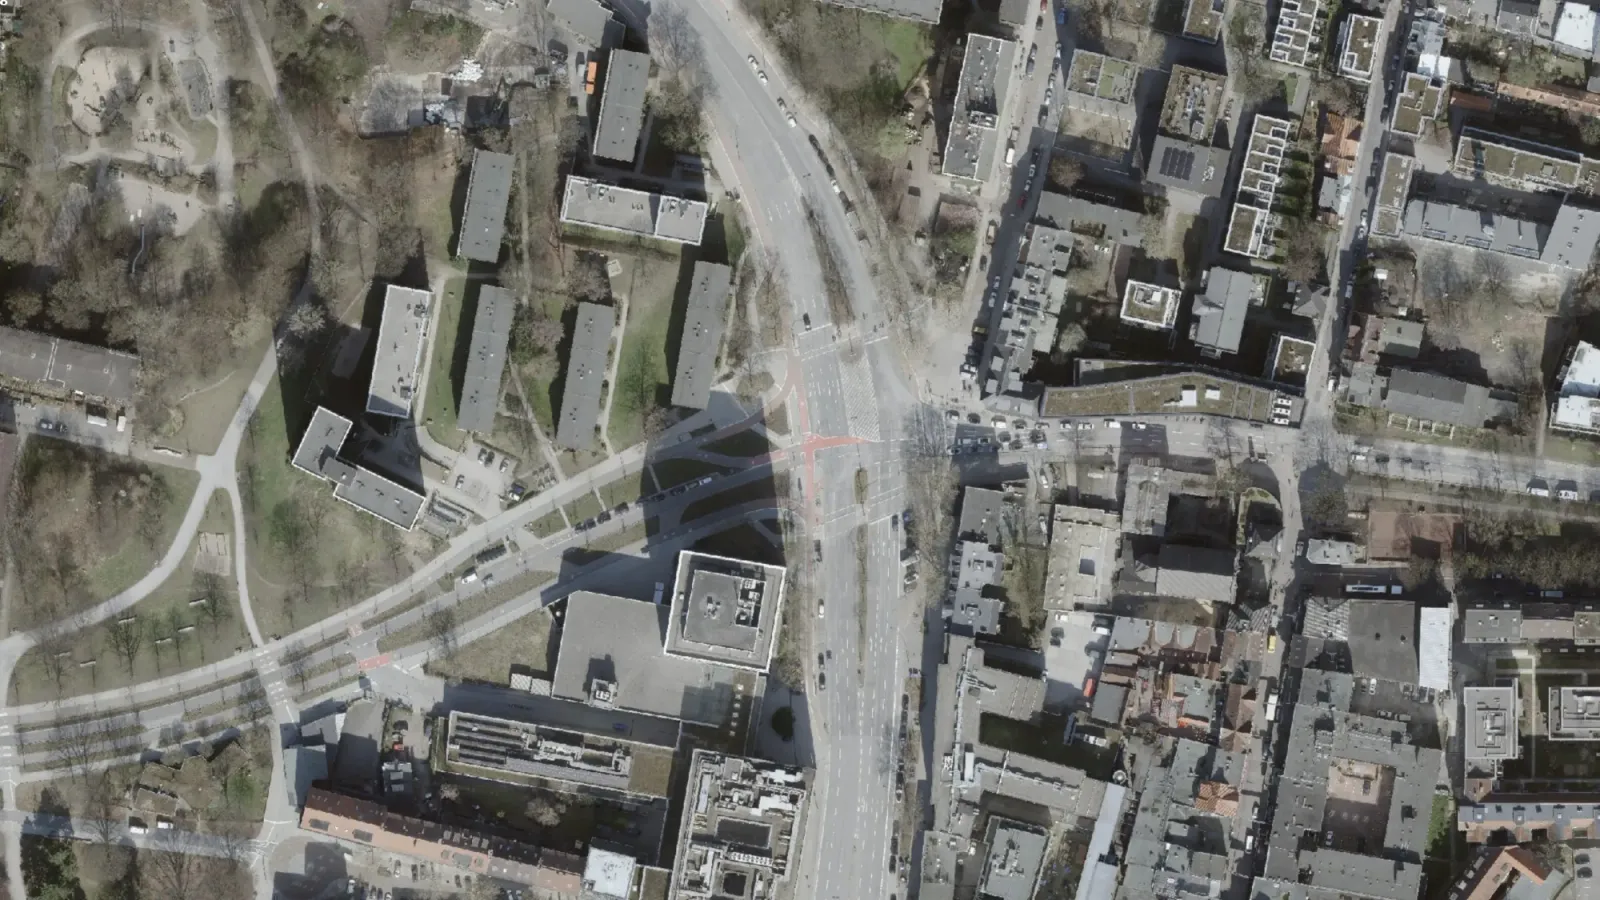
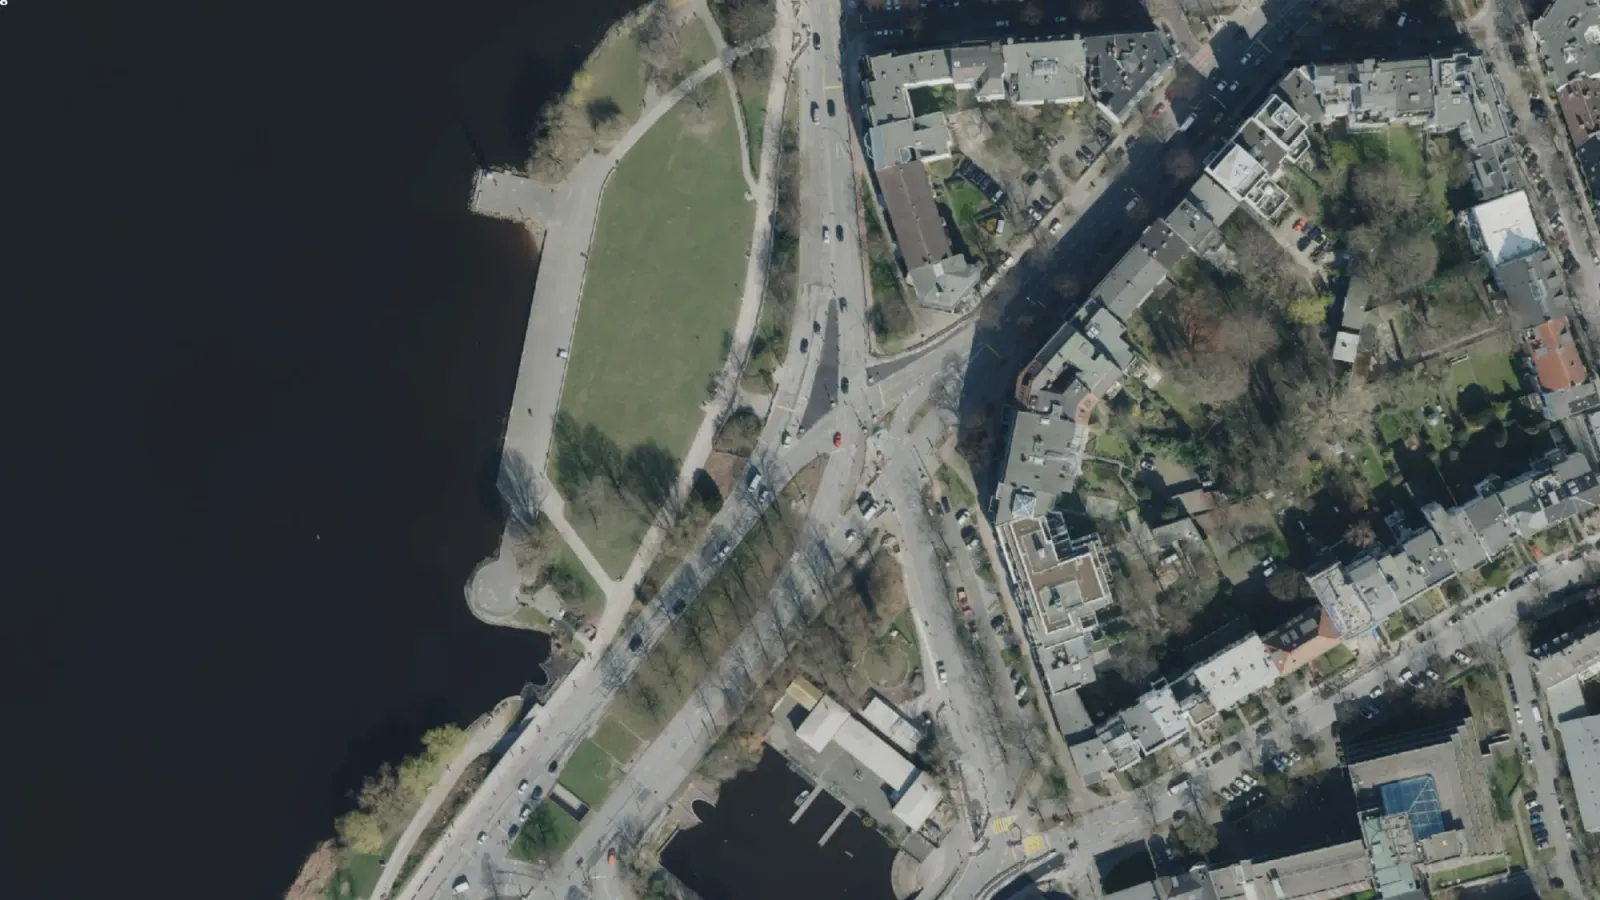
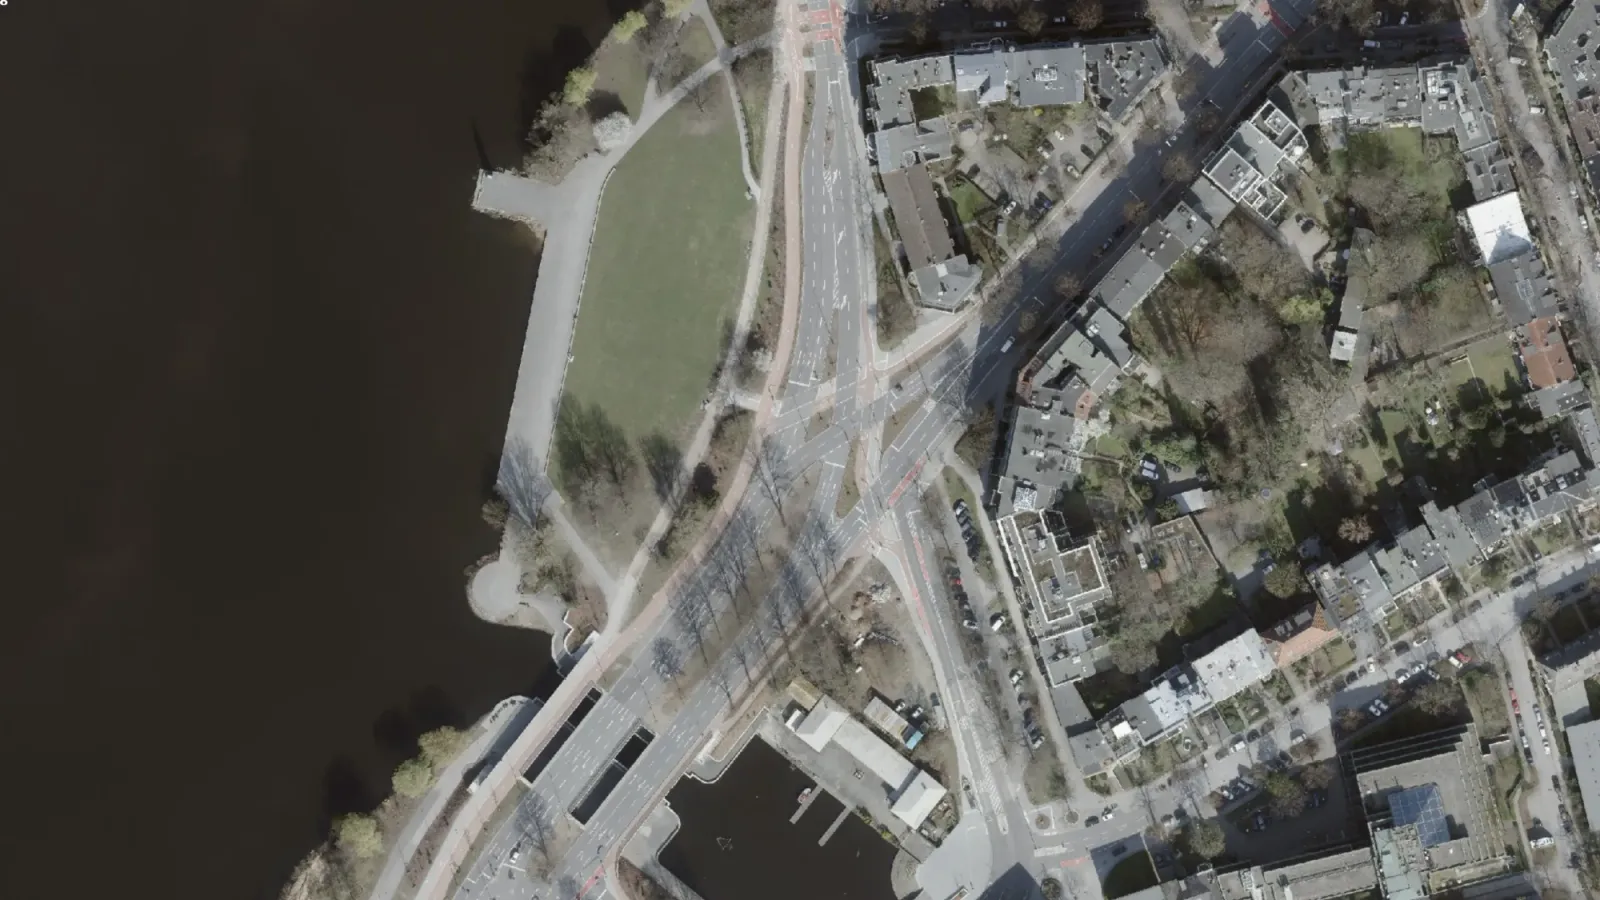
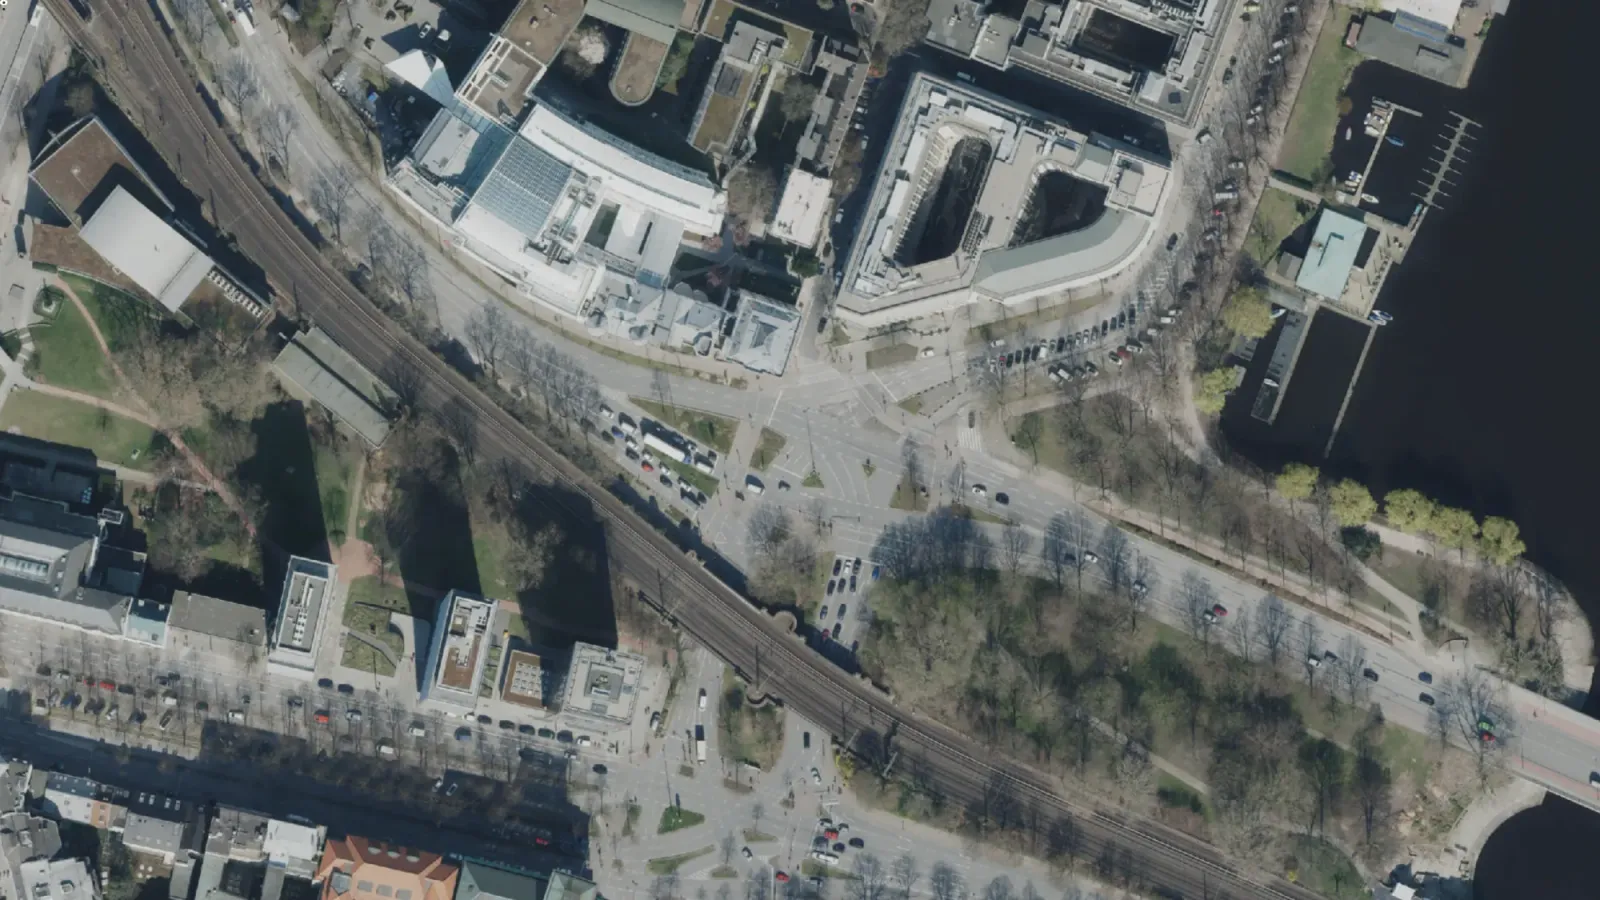
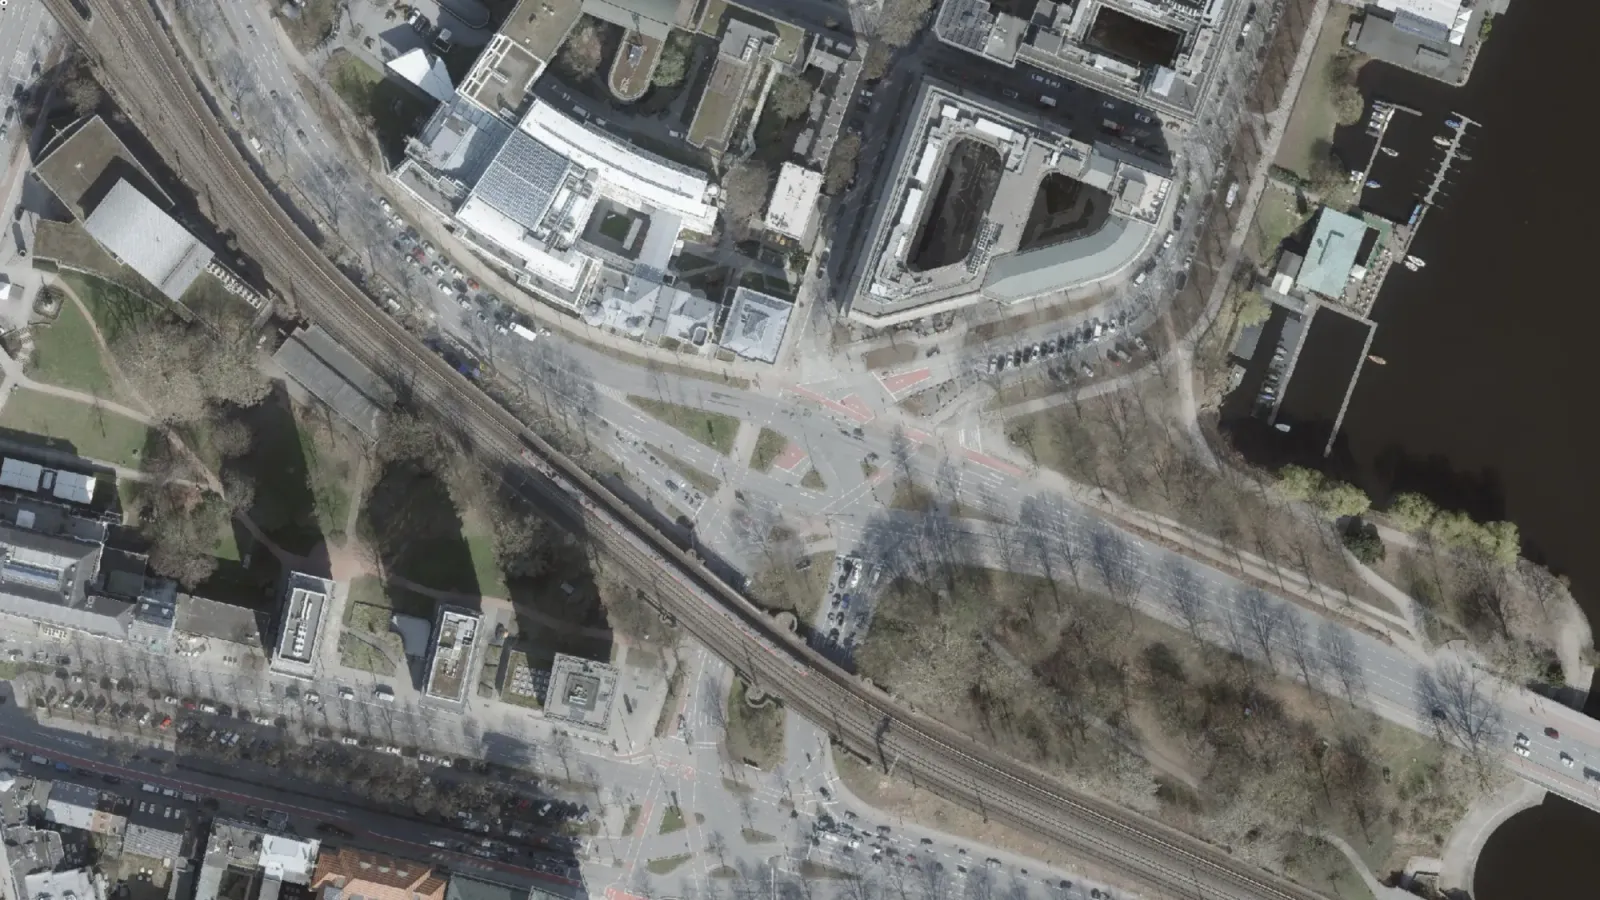
As I look more closely at each indicator, I will also include satellite images of Hamburg. These images will show how the cycling infrastructure has changed over time at intersections and along streets that I have used over the years.
Let’s dive in.
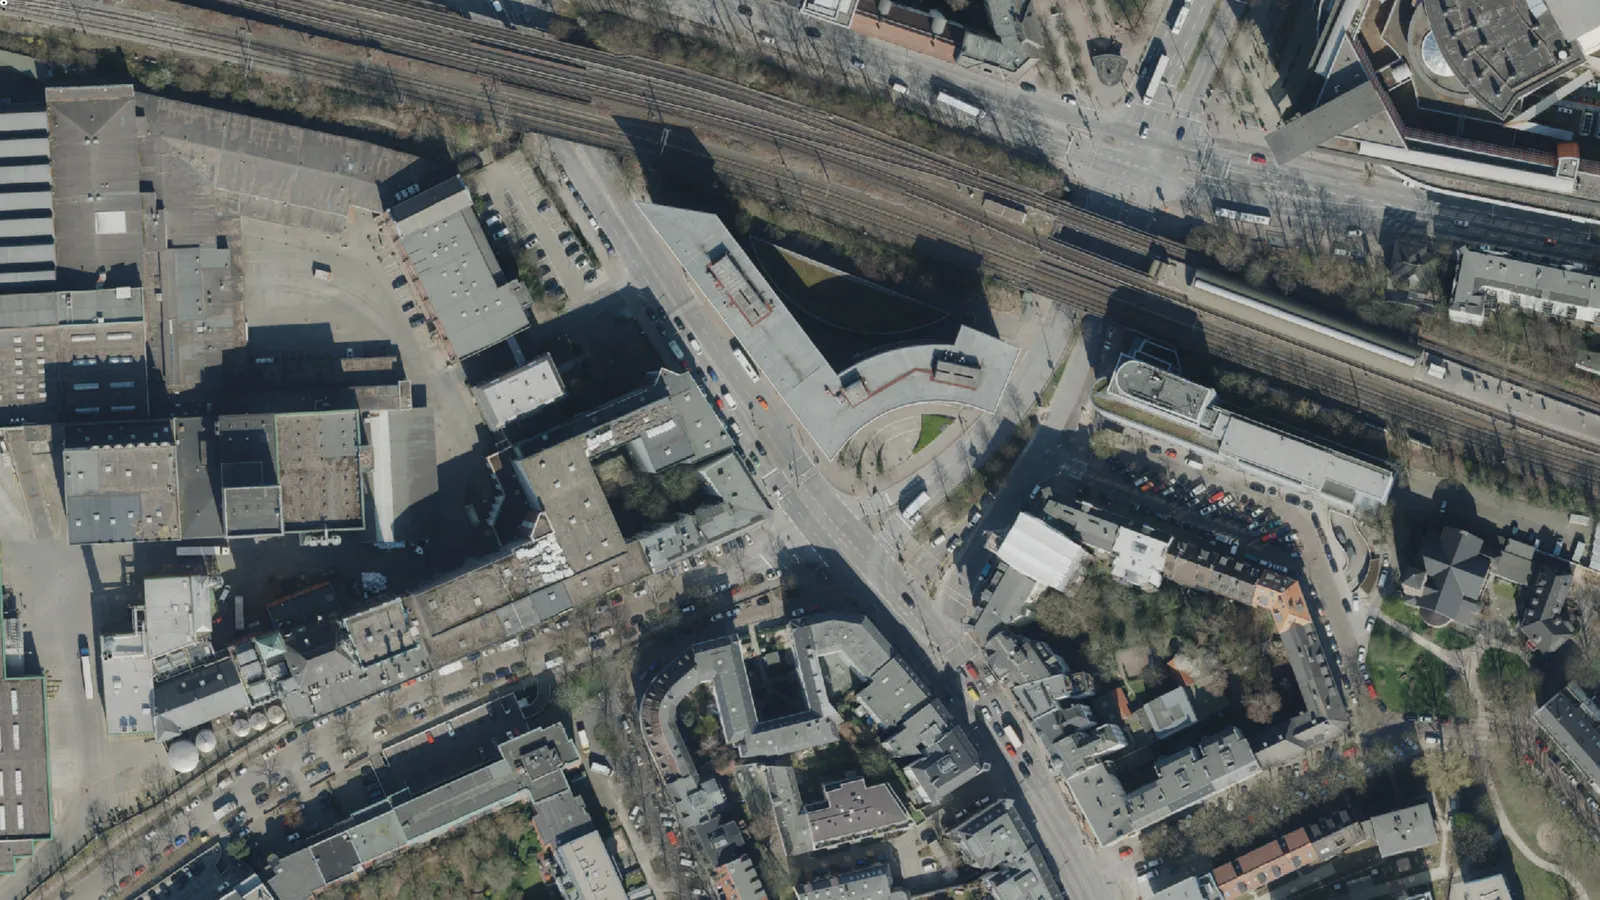
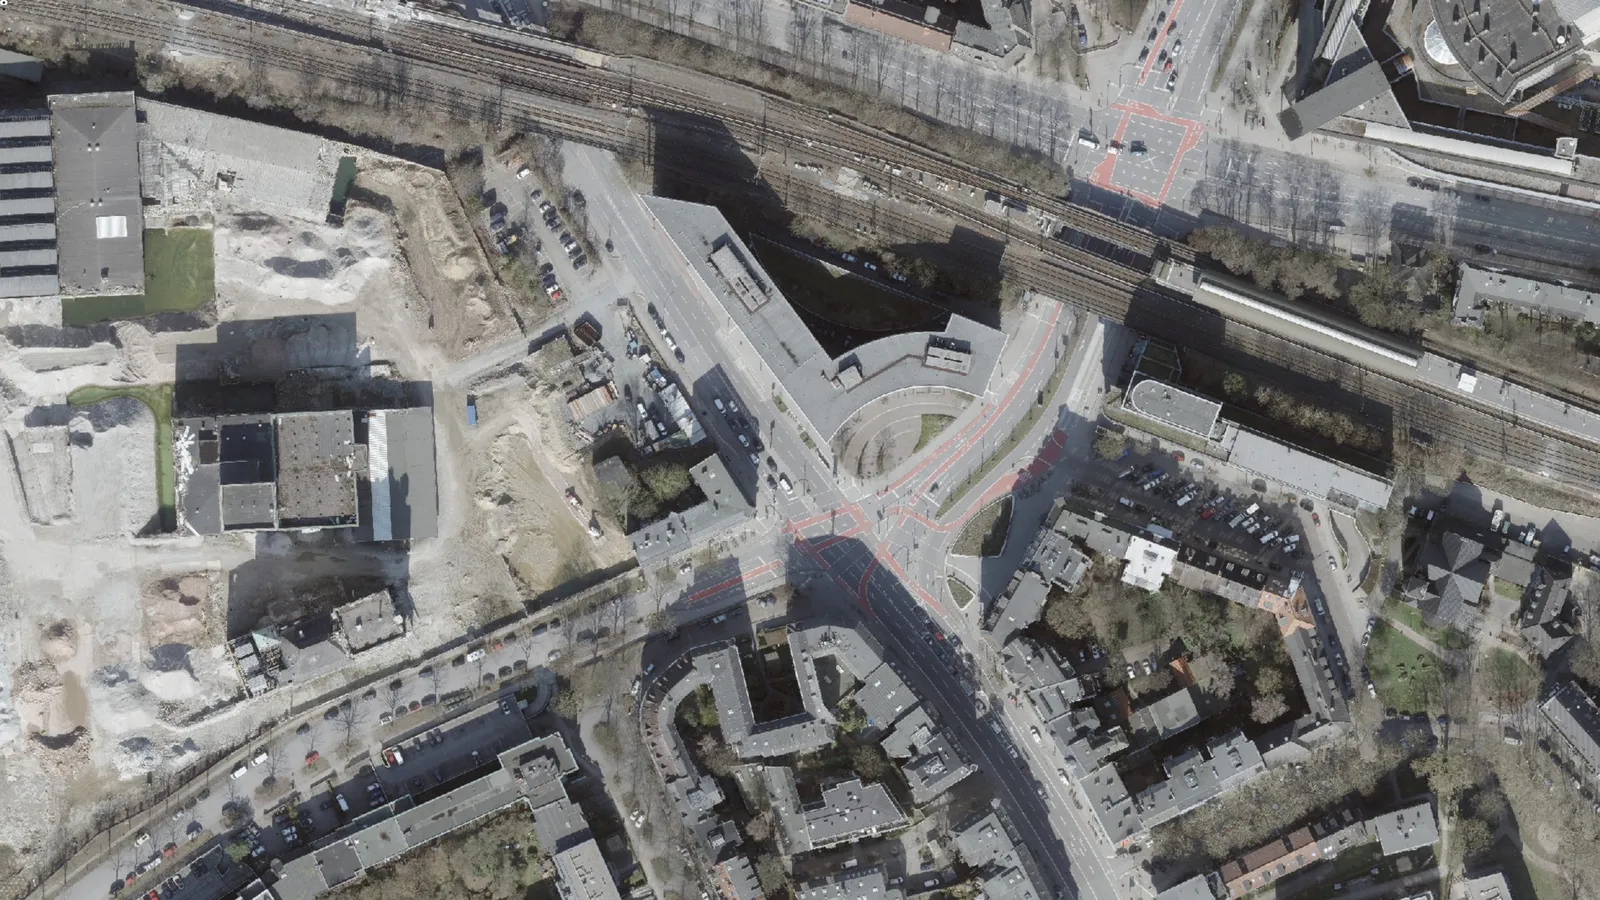 2020
2026
2020
2026
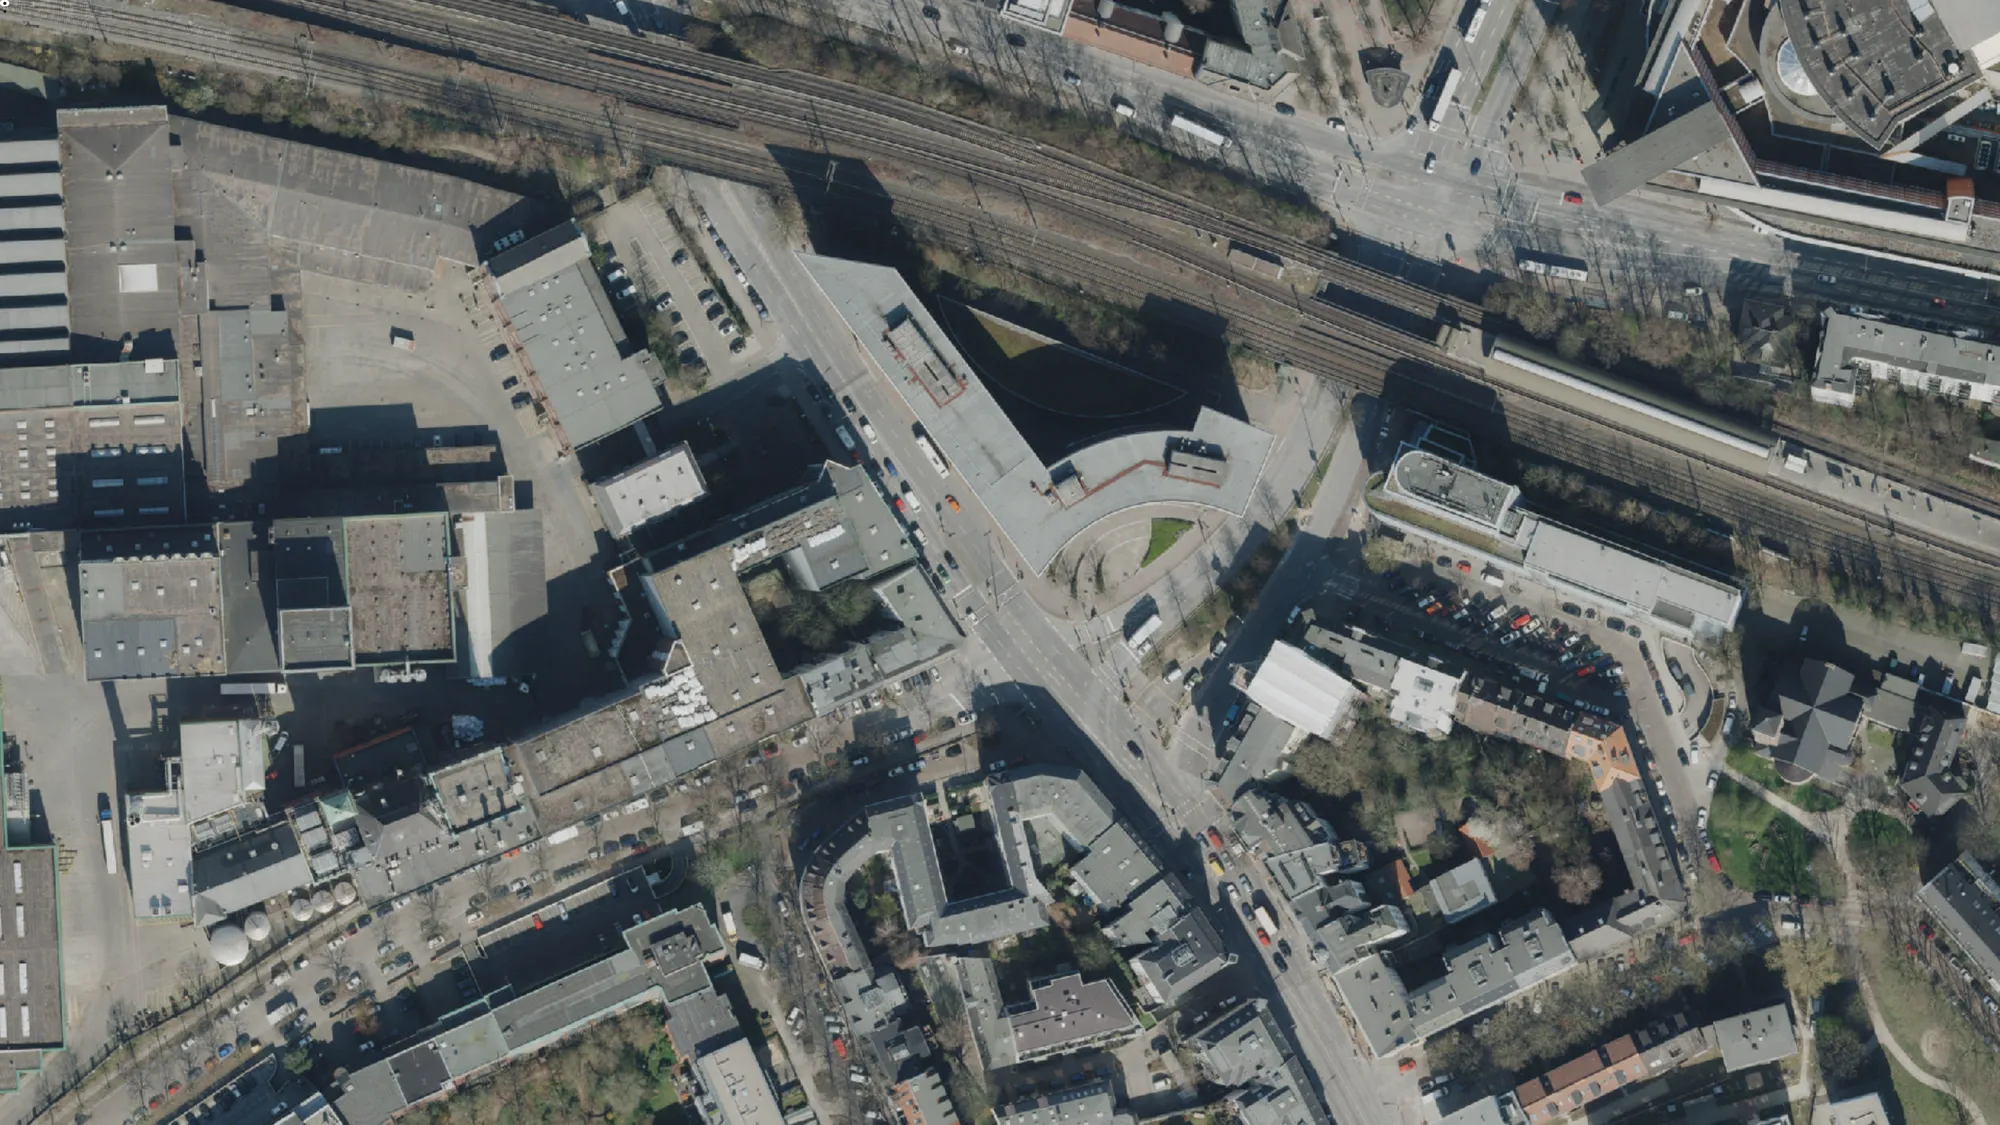
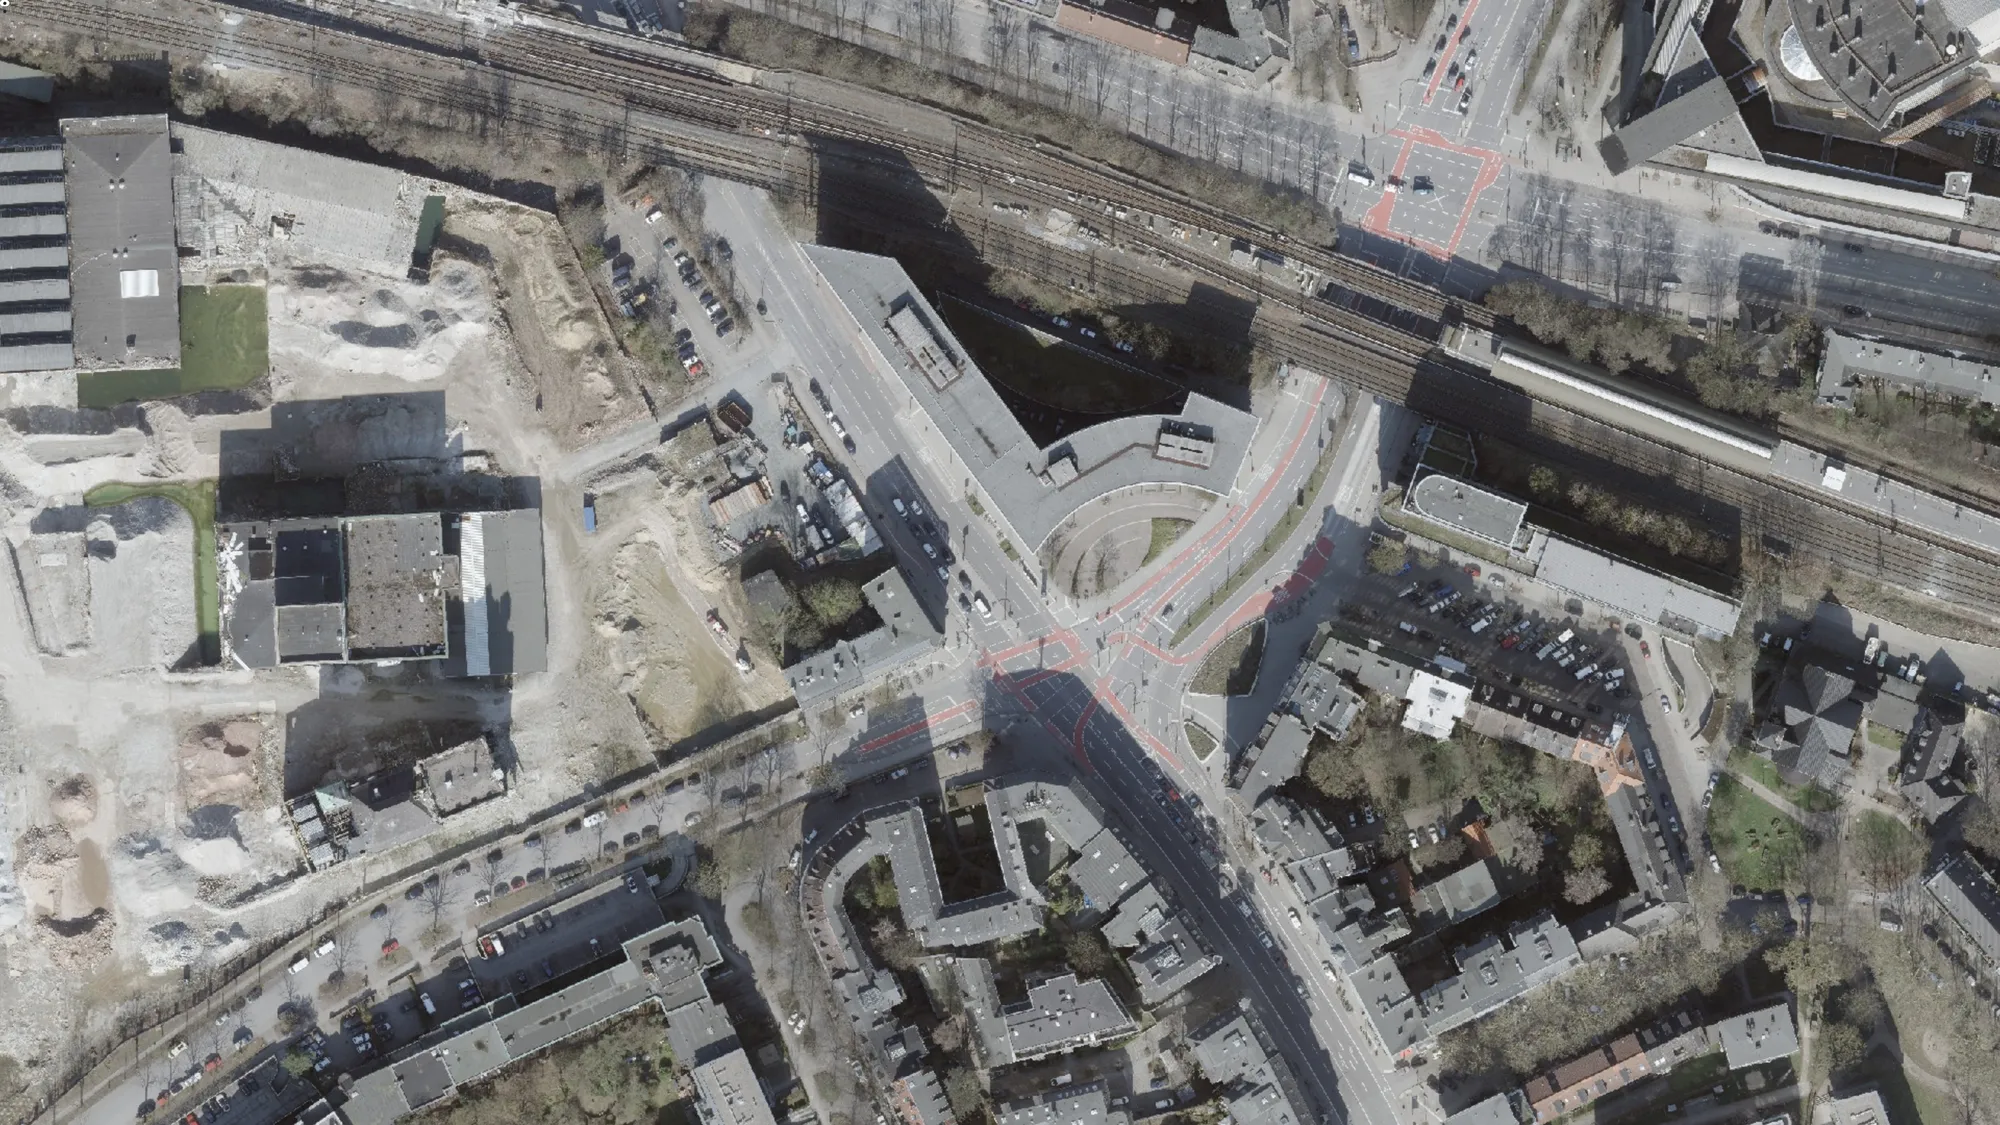
Holstenplatz 2020 vs. 2026
Pillars and Indicators
Safe & Connected Infrastructure
The physical infrastructure and street conditions that enable safe, continuous cycling.
1. Bicycle Infrastructure
The length of physically protected cycling space, including separated cycle tracks and buffered or curb-protected on-street lanes, relative to the city's total roadway network.
Hamburg's value: ~29 km of protected cycling infrastructure per 100 km of roadway. [1][2]
2. Bicycle Parking
The number of public street racks and enclosed bicycle-parking spaces within the city boundary relative to the number of residents.
Hamburg's value: ~35 spaces per 1.000 residents. [3][4][5]
3. Traffic Calming
The share of the city's street network with a speed limit of 30 km/h or lower, including 20 km/h zones and designated bicycle streets.
Hamburg's value: ~60% of the total street network. [6]
4. Safety
The annual cyclist fatality rate as the number of people riding bicycles who are killed in road traffic per 100.000 residents.
Hamburg's value: 0,59 cyclist fatalities per 100.000 residents. [7][5]
 2020
2026
2020
2026
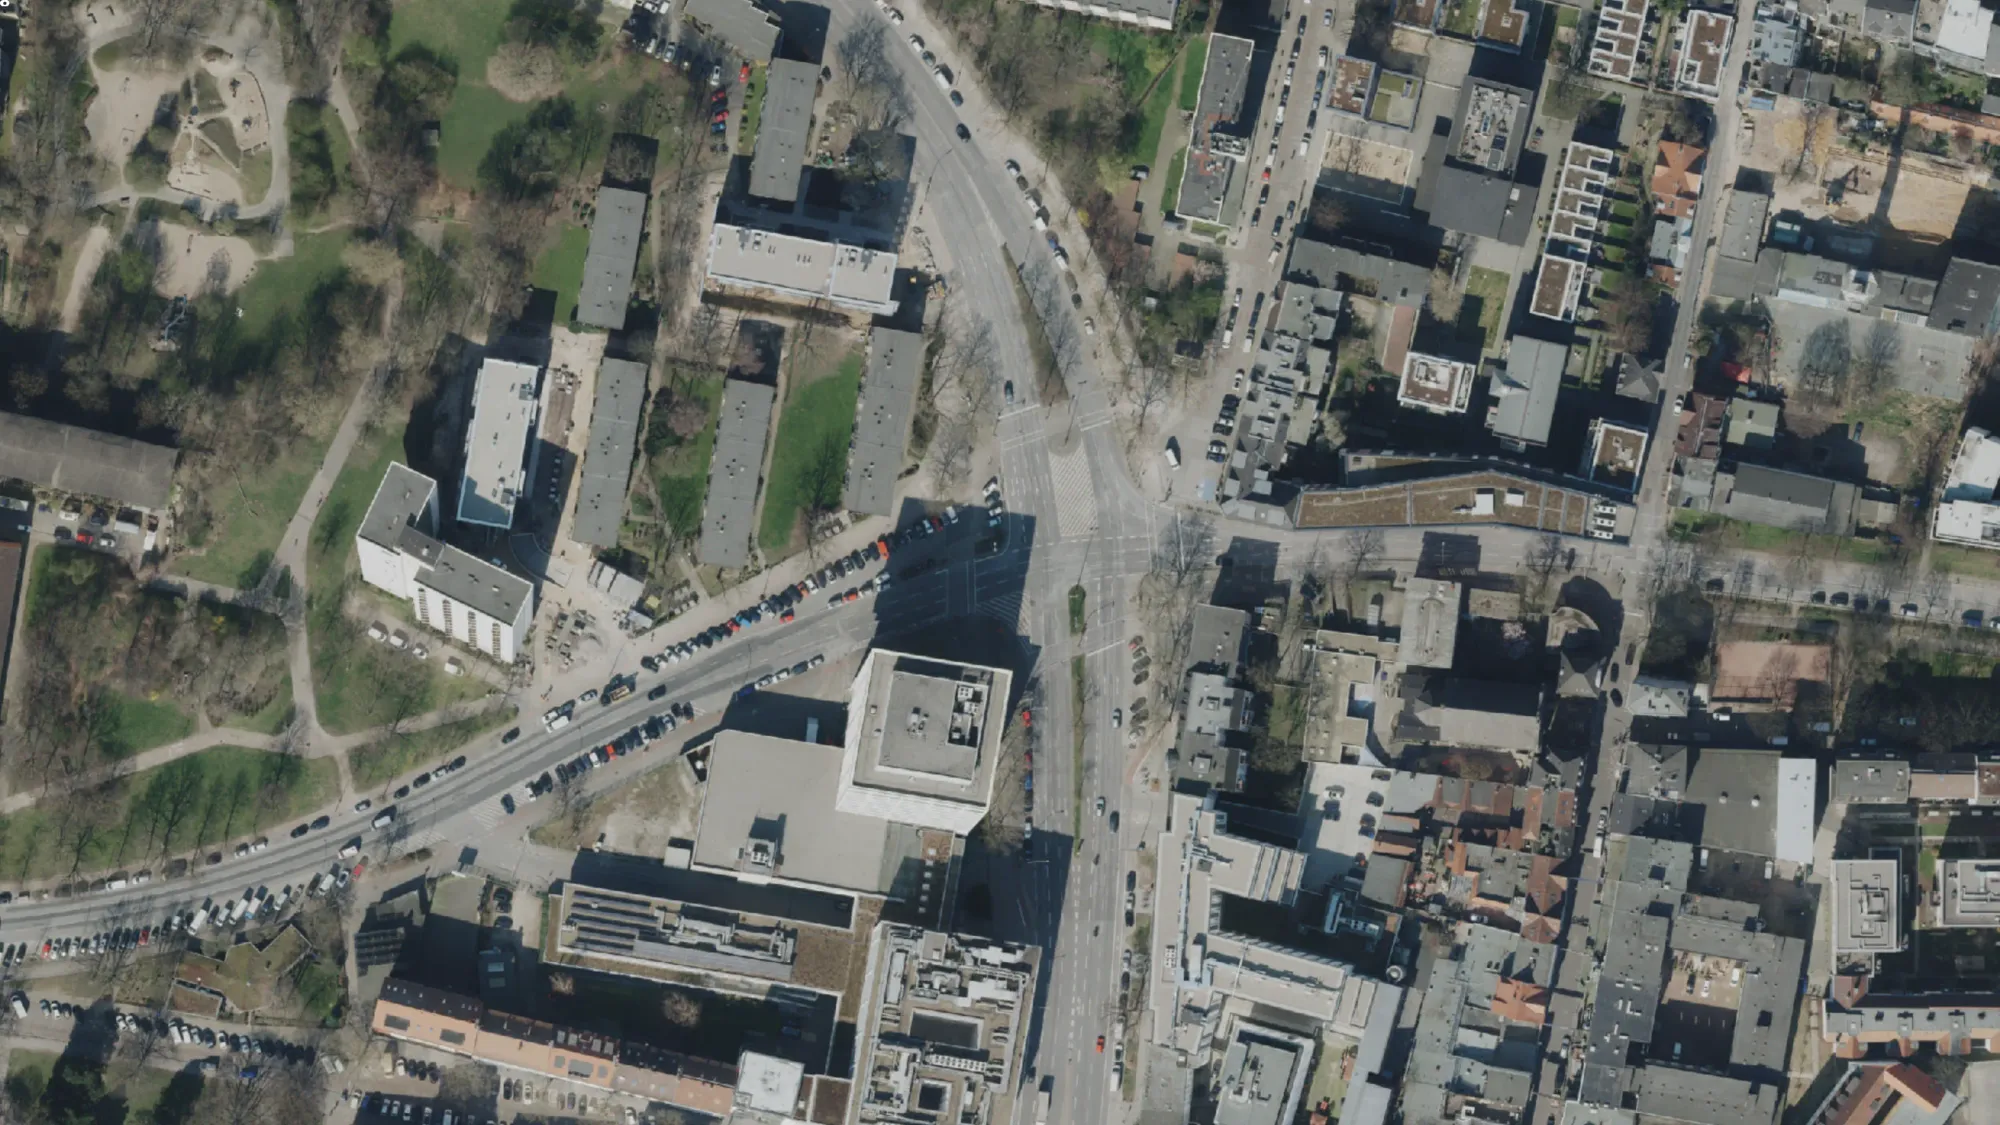
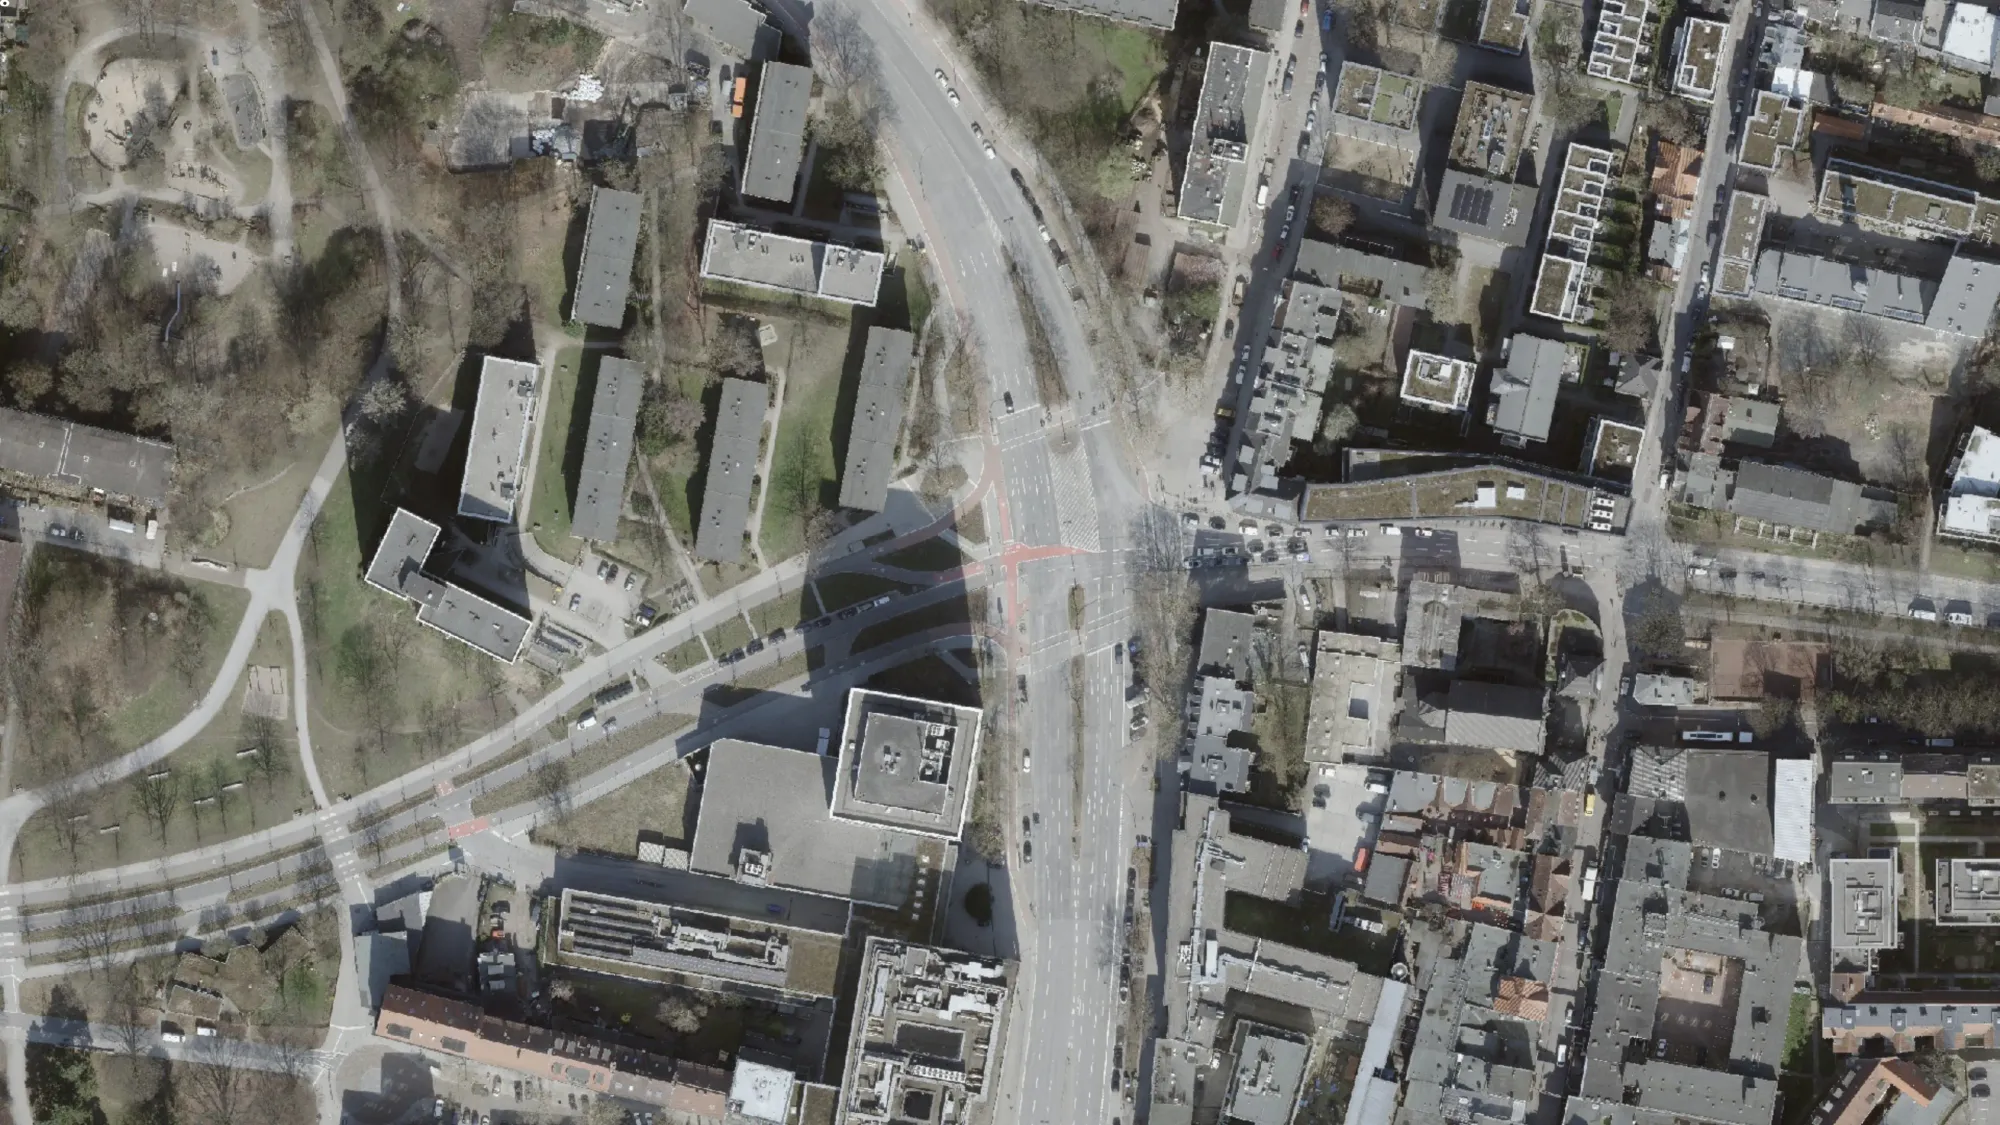
Louise-Schroeder-Straße 2020 vs. 2026
Usage & Reach
How cycling infrastructure and policy are reflected in everyday travel.
5. Bicycle Modal Share
The percentage of all daily motorized and non-motorized trips made by bicycle within the city's administrative boundary.
Hamburg's value: 16% of all daily trips. [8]
6. Modal Share Growth
The percentage-point change in the bicycle share of all daily trips between 2019 and 2024.
Hamburg's value: +1 percentage point. [8]
7. Women's Share of Bicycle Trips
The percentage of all bicycle trips made by women.
Hamburg's value: 44% of bicycle trips. [8]
8. Bike Share System
Whether the city operates a comprehensive, year-round docked or dockless bicycle-sharing system.
- Coverage density: Bikes per 1,000 residents.
- Usage rate: Trips per bicycle per day.
- Public-transport integration: Whether the bike-share app or smart card is fully interoperable with the city's public-transport ticketing system.
Hamburg's values:
- Coverage density: 2.4 bikes per 1,000 residents - approximately 4,500 StadtRAD bicycles across approximately 370 stations for 1,869,473 residents. [10]
- Usage rate: 2.8 trips per bicycle per day - approximately 4.6 million StadtRAD trips annually. [10][5]
- Public-transport integration: Yes, fully integrated. (hvv switch) [9]
9. Cargo Bikes
Whether cargo bikes are part of everyday family transport and last-mile logistics. A cargo bike is a pedal-powered or electric cycle with built-in load capacity, such as a box bike, long-tail bicycle, front-loader, trailer, or tricycle.
a. Household Purchase Subsidy
Whether the city offers rebates or grants to residents who purchase cargo bikes for everyday travel.
Hamburg's value: No - expired. Hamburg previously operated the `#moinzukunft` municipal rebate programme, which provided up to 2.000€ for electric cargo bikes. There is currently no active municipal purchase grant for private individuals.
b. Logistics or Business Support
Whether the city offers grants, tax benefits, or business-support programmes for companies adopting cargo bikes.
Hamburg's value: Yes. [11] Companies in Hamburg can access the federal BAFA commercial electric cargo-bike grant, covering 25% of purchase costs up to 3.500€, alongside local project funding for fleet electrification through IFB Hamburg.
c. Commercial or Informal Adoption
Whether parcel companies, local businesses, supermarkets, municipal services, or community initiatives operate cargo-bike fleets.
Hamburg's value: Yes - high. [12] Cargo bikes are used by parcel companies through inner-city micro-hubs. Hamburg also has 56 shared Lastenpedelecs in the StadtRAD network and community initiatives such as Klara.
d. Supportive Infrastructure and Standards
Whether the city has cargo-bike-specific measures such as loading bays, extra-wide racks, marked parking spaces, or cycle-street design standards suitable for cargo bikes.
Hamburg's value: Yes. [13][24] Cargo bikes may park free of charge in vehicle parking bays. Hamburg's PLAST 9 design guidance specifies widths of 2,25 to 2,50 metres for cycle paths and cycle streets to accommodate cargo bikes.
 2020
2026
2020
2026
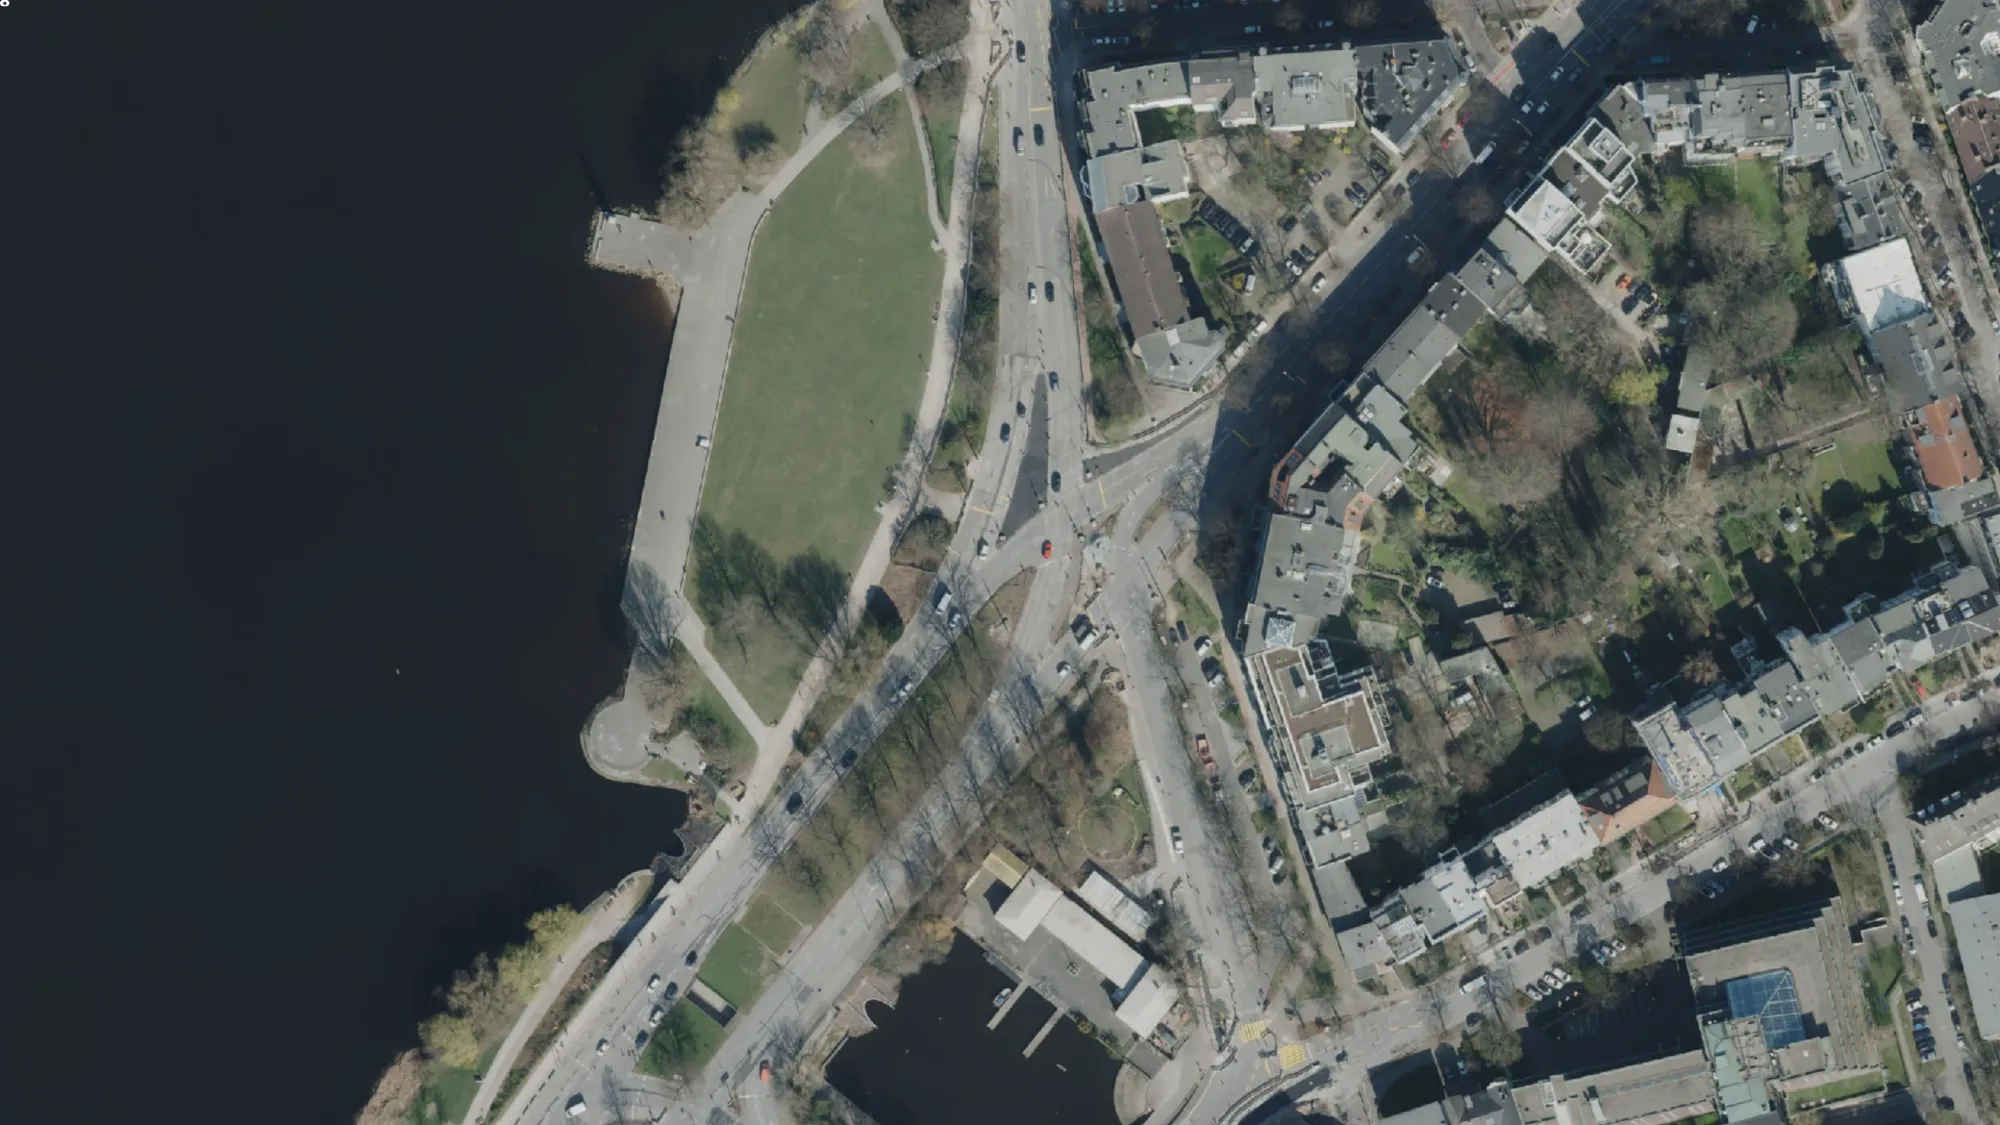
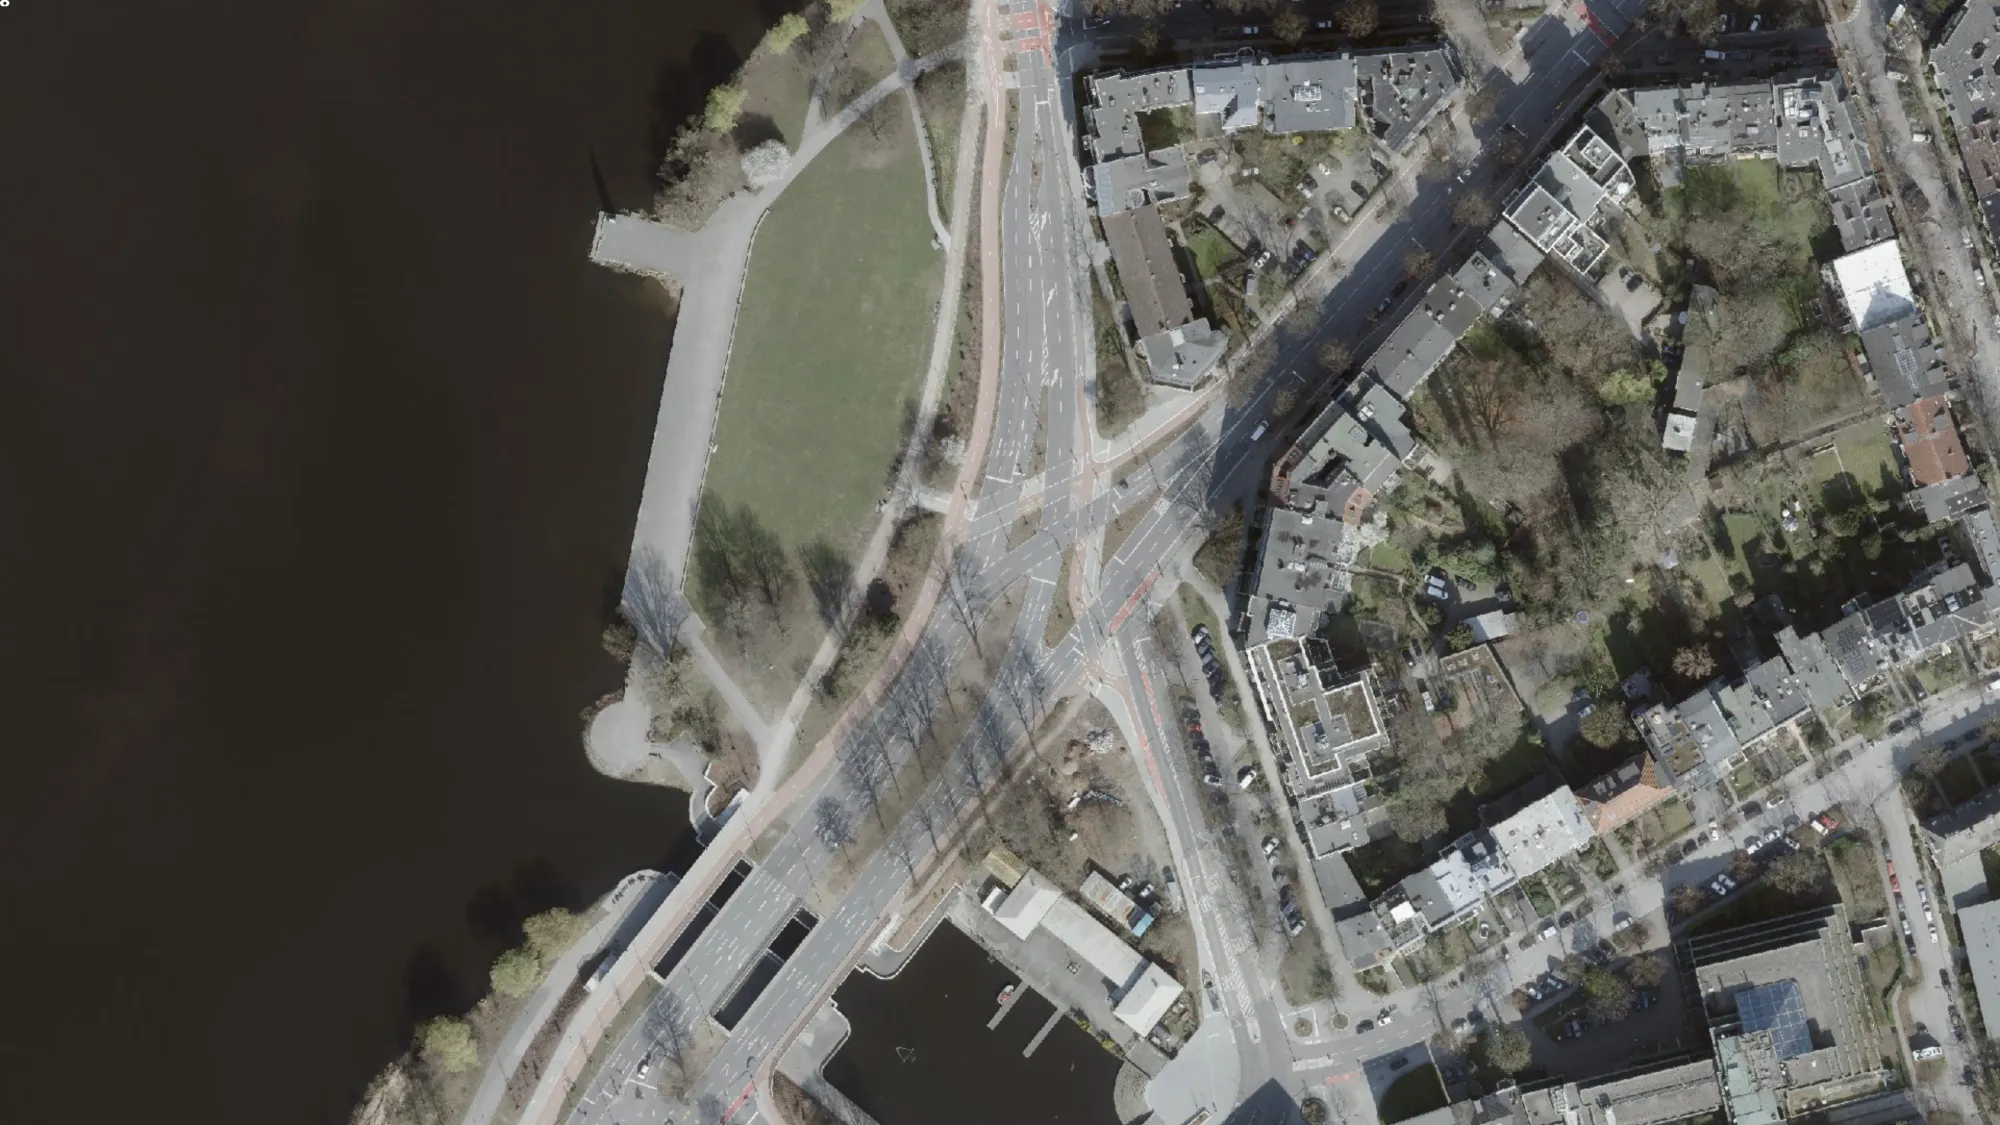
Hohenfelder Bucht 2020 vs. 2026
Policy & Support
The institutional, political, and cultural conditions that support long-term cycling progress.
10. Political Commitment
How much money the city government sets aside for cycling investment per resident each year, averaged over the most recent five-year period.
Hamburg's value: 44€ per resident per year. [14][15][5]
11. Advocacy
This indicator assesses the strength and civic influence of local cycling advocacy groups by checking whether an active citywide organization engages with the public and participates in policymaking.
a. Active Organization
Whether at least one citywide cycling organization publishes regular updates through a website, newsletter, or social media.
Hamburg's value: Yes. [16] ADFC Hamburg has more than 9.000 members, publishes the quarterly print and digital magazine _RadCity_, and operates newsletters and social media channels.
b. Public Mobilization
Whether the organization has conducted at least two rides, campaigns, or events during the previous 12 months.
Hamburg's value: Yes. [17] ADFC Hamburg co-organizes campaigns and rides including Fahrradsternfahrt Hamburg, Kidical Mass, and STADTRADELN.
c. Policy Involvement
Whether the organization sits on an official committee or has contributed to cycling policy during the previous 24 months.
Hamburg's value: Yes. [16][14] ADFC Hamburg is a civil-society signatory and consultation partner in the Bündnis für den Rad- und Fußverkehr and participates in district traffic committees.
12. Image of the Bicycle
Whether the bicycle is recognized and promoted as a normal means of everyday transport for people of different ages and social groups.
a. Media Tone
This component classifies cycling-related headlines published by the city's three largest online news outlets during the previous 24 months as positive, neutral, or negative.
Hamburg's value: Mixed or neutral-to-critical. [20][21][22] Coverage in Hamburger Abendblatt, NDR Hamburg, and MOPO combines reporting on the practical and environmental benefits of cycling with conflict-focused reporting about construction, road-space reallocation, and interactions between pedestrians and cyclists.
b. Bicycle Brand or Network Identity
Whether the city uses a distinct visual identity for its main cycling network or citywide cycling promotion.
Hamburg's value: Yes. [18] Hamburg's main cycling network is branded as the Velorouten-Netz, consisting of 14 radial routes and two ring routes. It uses red-and-white directional signs, route numbers, and standardized road markings.
c. School Cycling Education
Whether the city participates in an official national or regional learn-to-ride programme that provides practical bicycle training in schools.
Hamburg's value: Yes. [19] Hamburg provides cycling education in grades 3 and 4 through police traffic instructors. The programme includes bicycle handling, road-traffic practice, and a final test for the Fahrradpass.
13. Urban Planning
Whether the city has the strategic and technical capacity to plan, design, deliver, and monitor protected cycling infrastructure consistently.
Unit: Kilometres of protected cycling infrastructure built during the last three calendar years per 100 km of roadway.
Hamburg's value: 3,17 km of protected cycling infrastructure per 100 km of roadway. [23]
The value is calculated from approximately 130 km of physically separated or protected cycling facilities built or renewed from 2022 to 2024 and approximately 4.100 km of municipal roadway.
a. Cycling Plan or Strategy
Whether a cycling plan, active-mobility plan, or mobility plan with a full cycling chapter has been published or updated during the previous five years.
Hamburg's value: Yes. [25] Hamburg updated its cycling strategy through the Bündnis für den Rad- und Fußverkehr and the Radverkehrsstrategie für Hamburg.
b. Dedicated Cycling Unit
Whether the municipal organization includes a staffed team whose primary responsibility is cycling infrastructure and policy.
Hamburg's value: Yes. [23] Hamburg has a dedicated cycling and walking division within the Behörde für Verkehr und Mobilitätswende.
c. Technical Design Guidebook
Whether the city uses a technical guide specifying layouts, dimensions, and treatments for cycling facilities, intersections, and parking.
Hamburg's value: Yes. [24] Hamburg uses ReStra, the Hamburger Regelwerke für Planung und Entwurf von Stadtstraßen, which defines design standards for cycling infrastructure and intersections.
d. Monitoring and Reporting
Whether the city publishes annual or biennial reports or open datasets that track cycling infrastructure, counts, or key performance indicators.
Hamburg's value: Yes. [23] Hamburg publishes progress reports, open geodata, and data from the Hamburger Radzählnetz.
 2020
2026
2020
2026
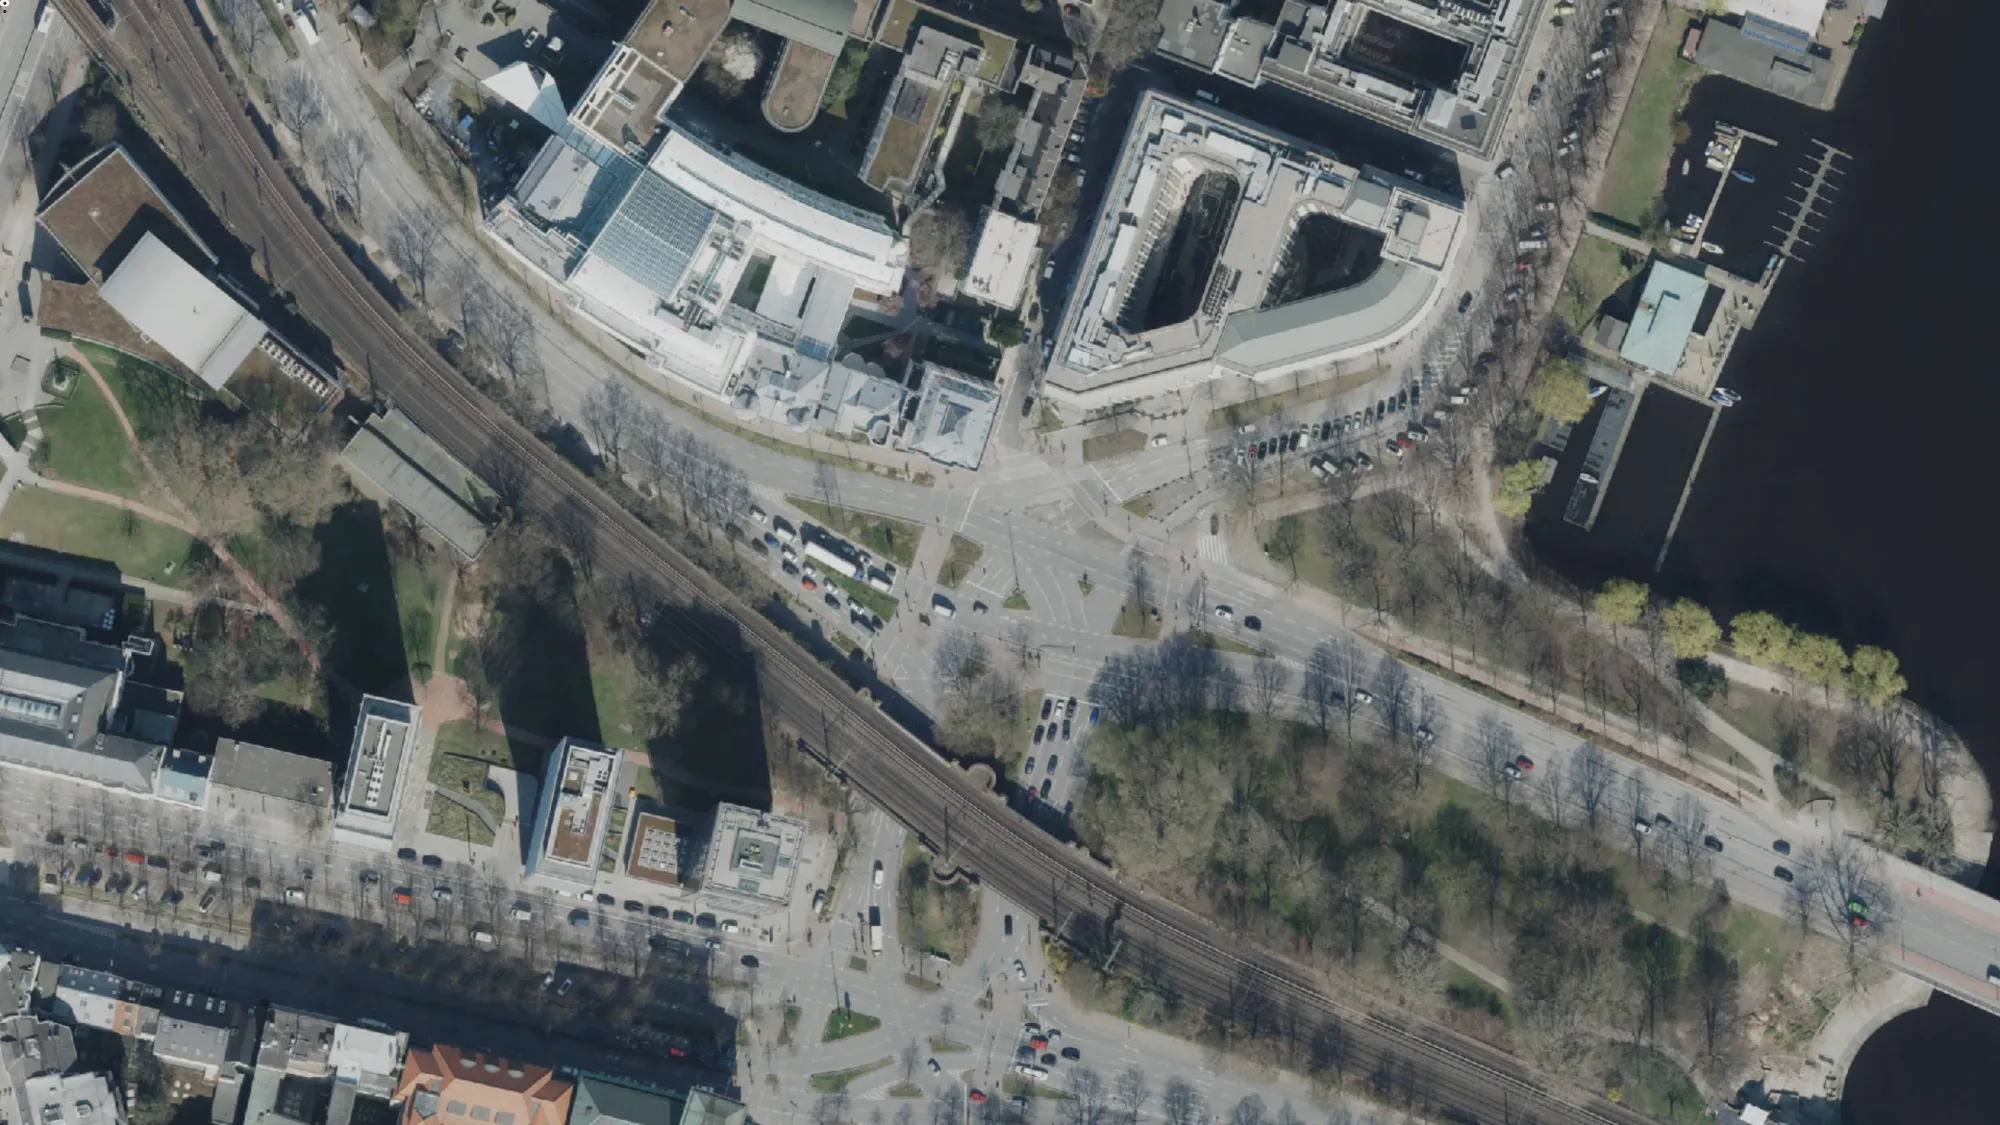
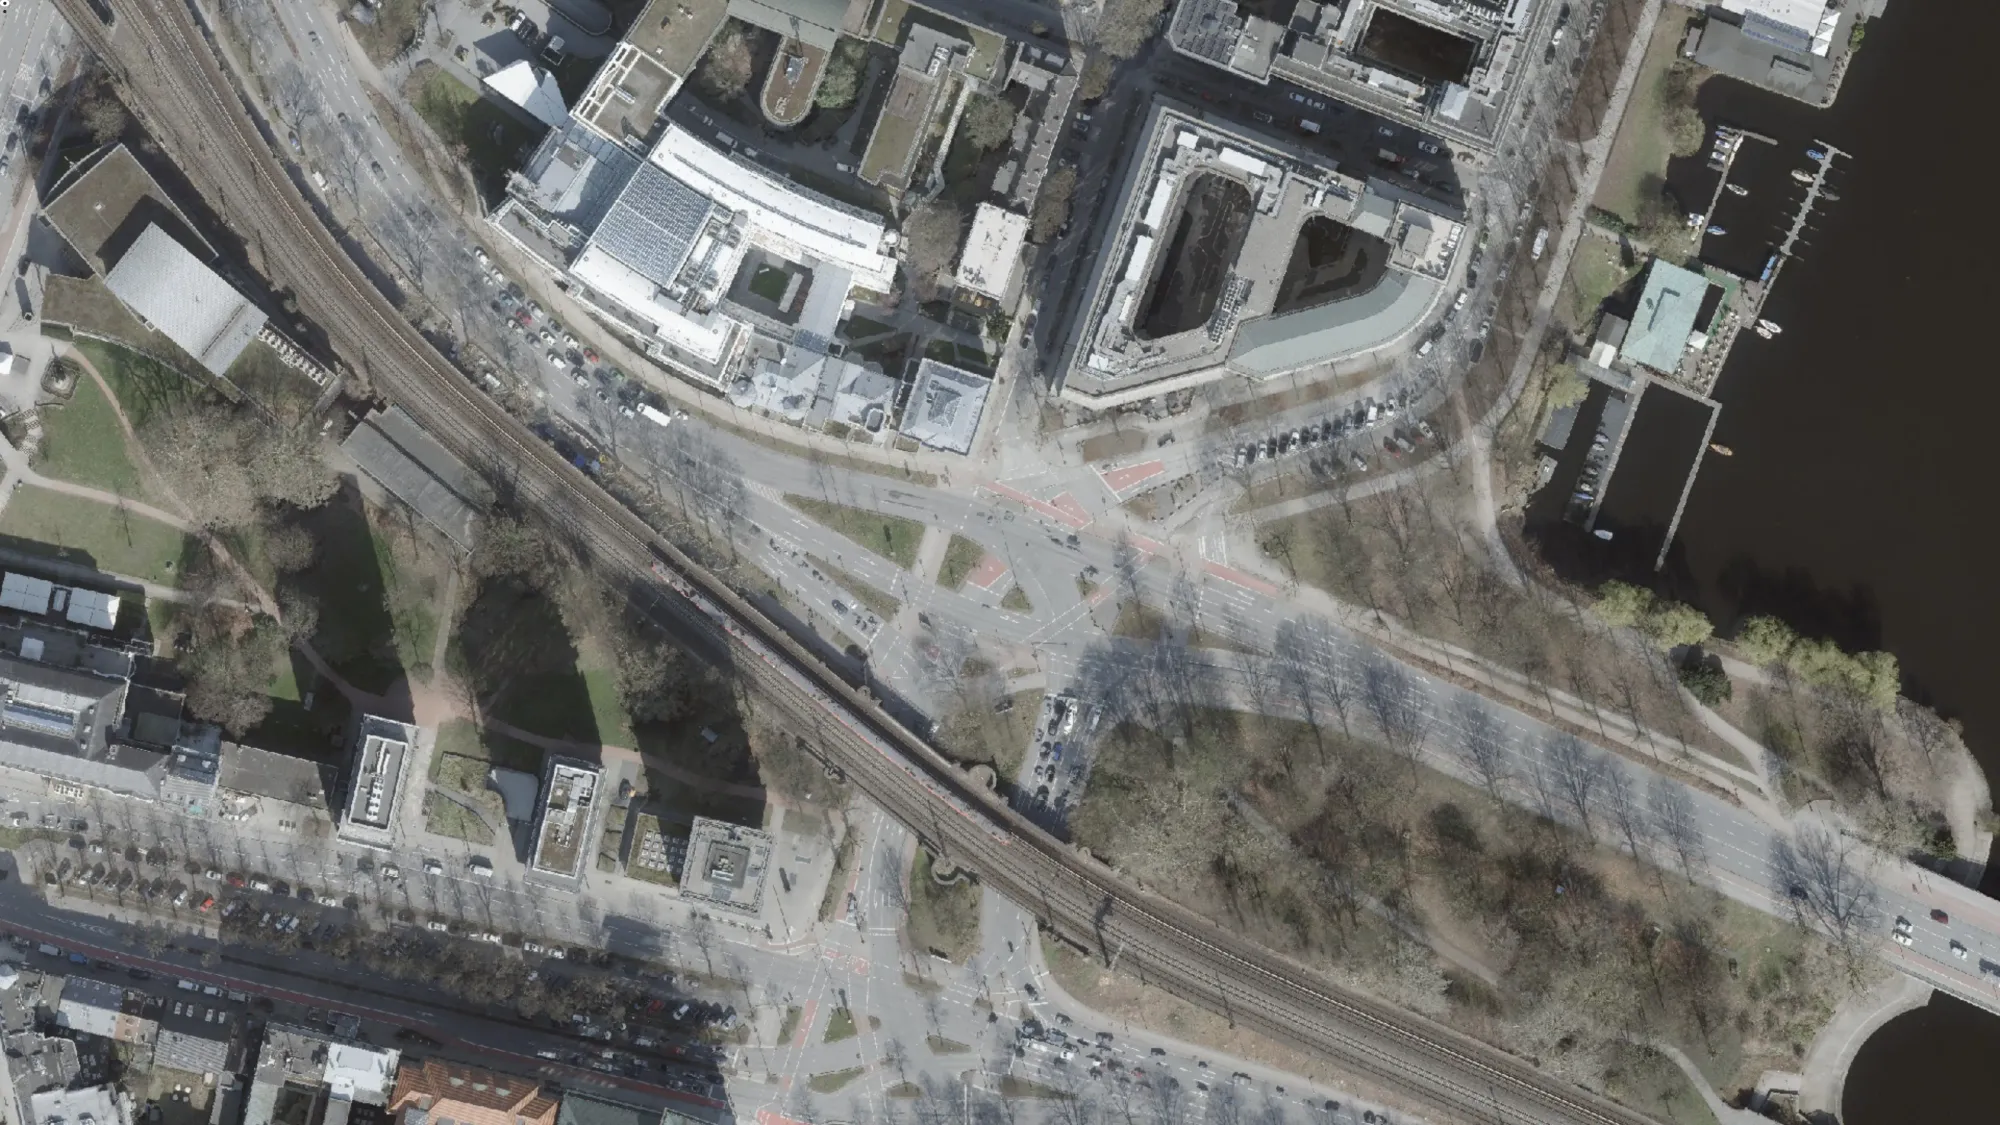
Alsterufer x Alsterglacis 2020 vs. 2026
Comparison with Utrecht
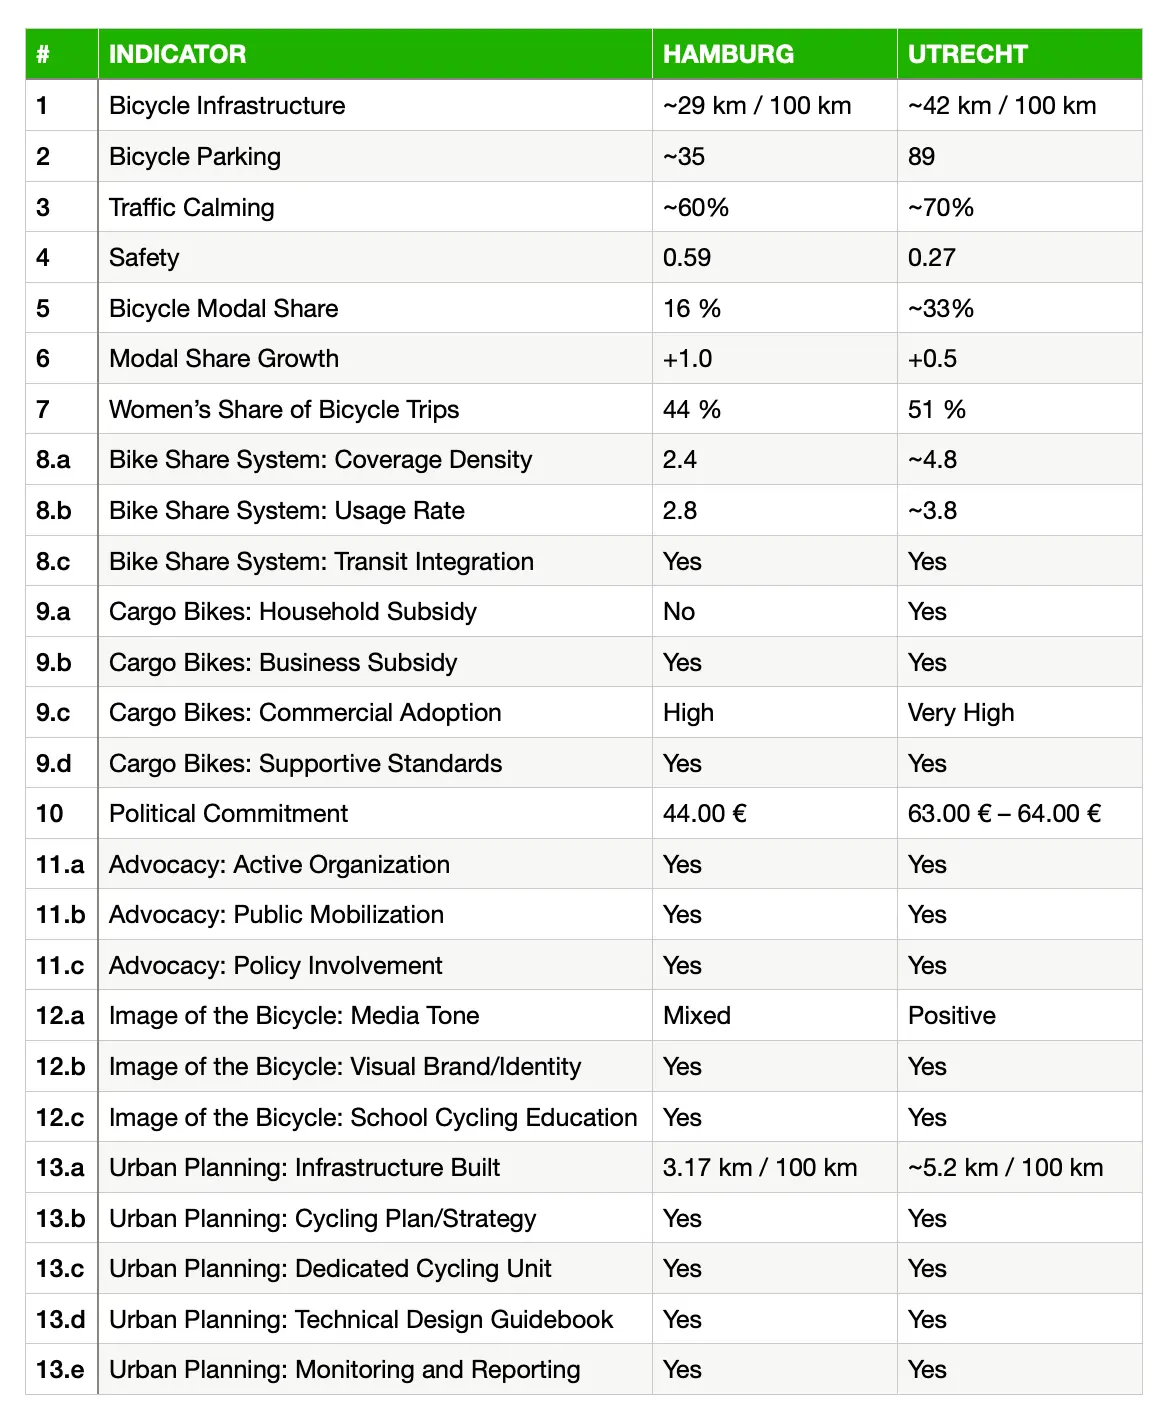
Looking at all the indicators, Hamburg is doing many things well. The city has cycling plans, standards, education, monitoring, and active advocacy groups. However, the comparison with Utrecht shows a clear gap, especially in infrastructure. Hamburg has around 29 km of cycling infrastructure per 100 km, compared with 42 km in Utrecht. Utrecht also has much more bicycle parking, and its bicycle modal share is around 33%, while Hamburg’s is only 16%.
This does not mean that Hamburg is doing a bad job. The city is moving in the right direction, and its bicycle modal share is growing. However, cycling infrastructure and bicycle use are closely connected. Without faster and stronger investment in safe and connected routes, it will be difficult for Hamburg to reach the level of Utrecht.
Conclusion
Of course, data tells one story and personal experience tells another. I enjoy cycling in some parts of Hamburg, but I feel unsafe in others. On roads without protected cycle lanes, I am always fully alert. The worst places for me are where cars park at a right angle to the cycle path. Drivers reversing out can barely see cyclists, so I have to slow down and watch every car and its rear lights. On some streets, cycle lanes also run between traffic lanes, so I end up being surrounded by cars or trucks.
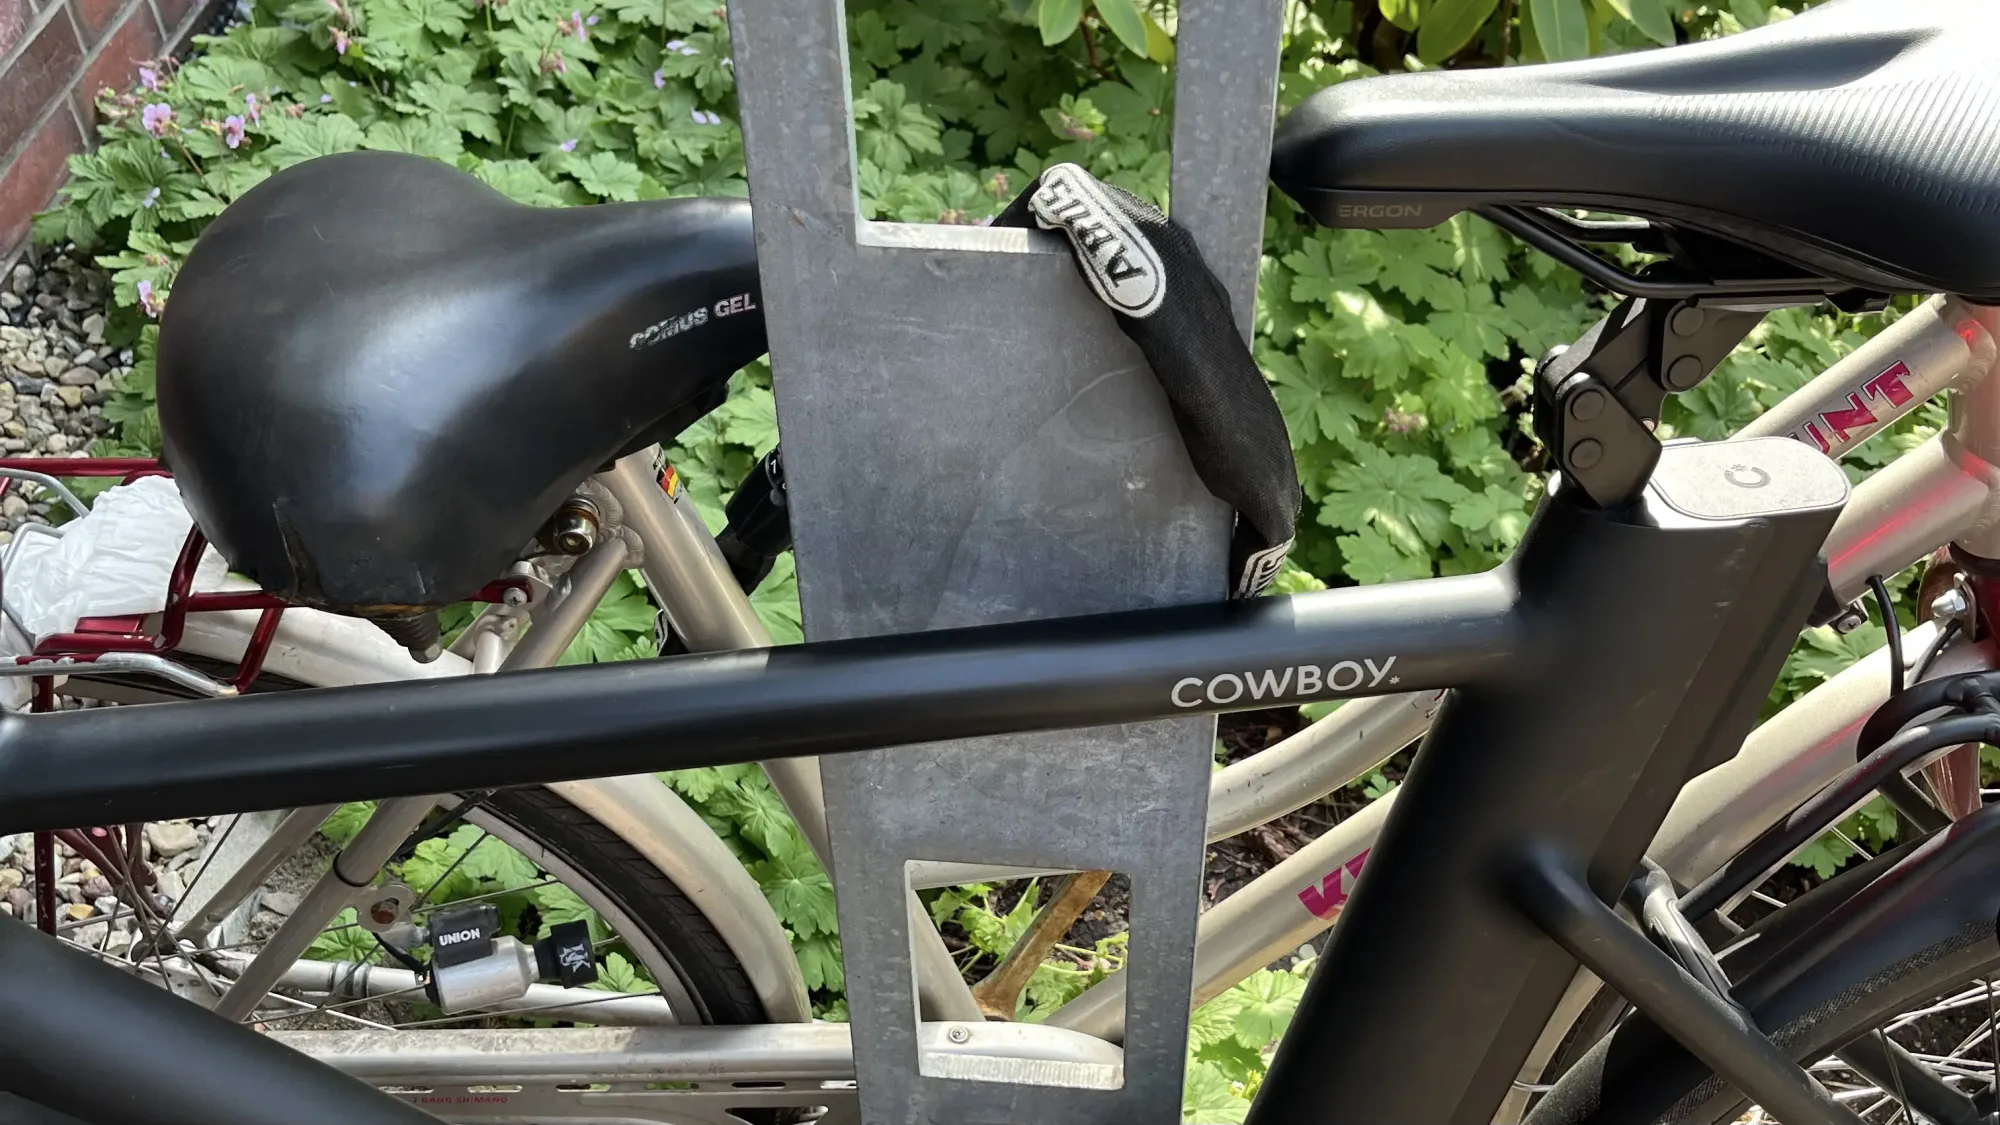
I am also annoyed by the lack of standard bicycle racks. Some racks make it impossible to lock my bike by its frame, while some busy areas have no racks at all.
Hamburg has already shared data with Copenhagenize, so the city is clearly aware of the Index. I hope it uses the indicators as a guide for future improvements. As the pictures and my own experience show, Hamburg’s cycling infrastructure is improving. I just hope the city can improve it faster and make cycling safer for everyone.
Data Sources
- [1] Radinfrastruktur - Wege Hamburg (9 July 2026)
- [2] Straßen- und Wegenetz Hamburg (16 July 2026)
- [3] Bike + Ride Anlagen Hamburg (22 August 2024)
- [4] Fahrradbügel Hamburg - Bezirksdaten (11 July 2025)
- [5] Bevölkerung in Hamburg 2025 - Amtliche Bevölkerungsfortschreibung (9 July 2026)
- [6] Hamburg Senate - Strategie Mobilitätswende (28 November 2023)
- [7] Verkehrssicherheitsbilanz 2025 - Polizei Hamburg (23 February 2026)
- [8] Mobilität in Deutschland (MiD) 2023 - Regionaler Kurzbericht Stadt Hamburg (19 December 2024)
- [9] StadtRAD jetzt in hvv switch - Behörde für Verkehr und Mobilitätswende Hamburg (30 June 2026)
- [10] StadtRAD Hamburg - Flotte und Stationen (2026)
- [11] E-Lastenfahrrad-Förderung für Unternehmen - BAFA (2024)
- [12] Lastenrad statt Lieferwagen - City-Mikrodepot im Regelbetrieb (30 November 2022)
- [13] Frei parken für Lastenräder in Hamburg - ADFC (20 December 2021)
- [14] Kurzbericht Rad- und Fußverkehr 2022 - Behörde für Verkehr und Mobilitätswende Hamburg
- [15] Hamburger Sport- und Infrastrukturbericht - Mitteleinsatz Radverkehr 2020-2024
- [16] Über den ADFC Hamburg e.V. (2026)
- [17] Sternfahrt 2026 - Gemeinsam für die Verkehrswende (23 June 2026)
- [18] Das Hamburger Radnetz and Wayfinding - Behörde für Verkehr und Mobilitätswende Hamburg (2024)
- [19] Verkehrssicherheitsarbeit der Polizei Hamburg (2024)
- [20] „Pop-up-Bikelane“: Bringt Radstreifen in Altona die Wende?
- [21] Elbchaussee zu eng: Schutzstreifen für Radfahrer wird entfernt
- [22] Nun also doch: Hamburg fällt 160 teils alte Bäume – für einen Radweg
- [23] Kurzbericht 2024 - Bündnis für den Rad- und Fußverkehr (2025)
- [24] Hamburger Regelwerke für Planung und Entwurf von Stadtstraßen (ReStra) (2026)
- [25] Hamburger Radverkehrsstrategie (2024)